CONTANGO
Maximise gains by shorting UVXY; profit from contango's drag on long-term futures pricing. Trade smart.
PROFIT FROM UVXY'S CONTANGO EFFECT!
- What is Share Trading01
- Key Features of Share Trading02
- Trade Both Long and Short03
- Calculating Profits and/or Losses04
- Share Trading Examples05
- Key Benefits of Shares06
- Margin Lending07
- Risks of Share Trading08
- Styles of Share Trading09
- Tools & Resources10
- How to Open an Account11
- Supported Brokers12
Contango Trading System
Contango is a system totally executed and supervised by MyTradingAdvisor on your trading account.
Our mission is to help our clients gain exposure to the stock market, without having to do any of the heavy lifting themselves. Best part – there are no joining fees and you can have the opportunity to have a professionally built strategy executed on your account.
1. Introducing Contango
Contango shorts UVXY based on technical indicators, employing exit, re-entry, overbought signals, and strict stop-loss rules for risk management.
This trading system is designed to capitalise on the unique behavior of UVXY, a leveraged volatility ETF that tends to depreciate over time due to contango in the volatility futures market. Contango occurs when the futures price of a commodity is higher than the spot price, which is a common scenario in volatility markets. As UVXY is rebalanced daily to maintain its leveraged position, it inherently suffers from decay when the future prices of VIX (the volatility index) contracts it holds are higher than the spot price of the VIX, a situation often seen in stable or gradually rising markets. The system exploits this predictable decline by entering short positions, anticipating that UVXY will lose value over time.
The strategy employs a set of rules based on technical analysis to determine the optimal entry and exit points for short positions. It uses the Average True Range (ATR) to assess volatility and manage risk, exiting positions when the price movement suggests unfavorable conditions. This is complemented by a re-entry rule that allows the strategy to capitalise on continued favorable conditions after taking profits. Additionally, the Relative Strength Index (RSI) is utilised to identify overbought conditions that may signal an opportune moment to enter a short position, based on the assumption that an overbought UVXY is likely to revert to its mean due to its structural decay.
Risk management is a cornerstone of the system, emphasising the importance of preserving capital while engaging in the inherently risky strategy of shorting a leveraged ETF. A predefined stop-loss rule ensures that losses are capped, protecting against unexpected market spikes in volatility that could lead to significant losses. By systematically adhering to these rules, the strategy aims to exploit the natural decay of UVXY due to contango while minimising exposure to sudden market reversals. This disciplined approach allows traders to potentially profit from the volatility ETF’s decline, with a structured framework to manage risk effectively.
| Contango | Details |
|---|---|
| Minimum Investment | **US$10,000 |
| Market | ProShares Ultra VIX Short-Term Futures ETF |
| Average Trade | 12.57 % |
| Average Trade Length | 4.5 Weeks |
| Percentage Winning Trades | 95.9% |
| Win:Loss Ratio | 0.14 |
** Note: If you only have US$10,000 allocated towards the strategy, we would suggest shorting no more than 35% of your account size (US$3,500 in this example) as the stop loss is 100% higher than the entry price. Shorting US$3,500 worth of UVXY could result in losses exceeding US$3,500 in unfavourable market conditions.
2. Why UVXY?
UVXY stands out as a prime candidate for traders aiming to exploit market volatility, offering a unique blend of challenges and opportunities. Its structure as a leveraged ETF provides amplified exposure to short-term movements in market volatility, specifically through the VIX index. However, this same structure also leads to its expected long-term decay due to the contango effect in the VIX futures market, where the futures prices are higher than the spot price of the VIX, leading to losses when these futures contracts are rolled over. This decay makes UVXY particularly attractive for short selling strategies. Furthermore, UVXY's high liquidity facilitates easier transactions, essential for executing timely trades. The ETF's transparency regarding its holdings and strategy aids traders in making informed decisions. Finally, despite its inherent risks, UVXY allows for structured risk management through disciplined trading strategies.
KEY POINTS:
1
Leveraged Exposure
Offers 1.5 times the daily returns of the VIX, magnifying both gains and losses.
2
Contango Decay:
Faces long-term value erosion due to the contango effect, beneficial for short selling.
3
Direct Volatility Trading
Provides a straightforward method to trade on market volatility.
4
High Liquidity
High trading volume ensures easier entry and exit, minimizing transaction costs.
5
Transparency
Clear information on holdings and strategy helps traders make informed decisions.
6
Structured Risk Management
Despite risks, allows for careful planning and execution of trades to manage potential losses.
3. Strategic Considerations
When engaging in trading strategies involving UVXY, traders must navigate a landscape filled with both opportunities and pitfalls. A strategic approach requires a deep understanding of the mechanics behind leveraged and volatility exchange-traded funds (ETFs) like UVXY, particularly how they respond to market movements and the structural decay over time due to contango. Successful traders in this arena often employ technical analysis and market sentiment indicators to time their entries and exits, capitalising on the ETF's inherent volatility. A foundational element of such strategies involves closely monitoring the VIX index and its futures, which underpin UVXY's price movements. The anticipation of volatility spikes or declines enables traders to position themselves advantageously, whether through short selling in anticipation of decay or carefully timed long positions during periods of expected market turmoil.
Moreover, the unique challenges posed by UVXY, such as its leveraged decay and susceptibility to sudden market changes, necessitate robust risk management strategies. Traders must set strict stop-loss orders and position sizes to safeguard against the amplified losses that leveraged products can incur. Given UVXY’s propensity for rapid price movements, a disciplined approach to risk management is not just advisable but essential for longevity in trading. This includes a willingness to quickly cut losses and the prudence to take profits when targets are reached, avoiding the common pitfalls of greed and overexposure. Additionally, staying informed about broader market trends and geopolitical events that could trigger volatility surges is crucial, as these factors can significantly impact UVXY’s performance.

This approach provides traders with a strategy focused on UVXY, combining long-term growth with risk management during volatility spikes through stop-loss orders. It involves taking profits systematically and reinvesting them to utilise compounding, aiming for portfolio growth and risk reduction. This method allows traders to take advantage of UVXY’s contango effect while protecting their investments from significant market shifts, offering a practical framework for continuous growth.
4. What is the Contango Strategy:
The Contango Strategy leverages the tendency of futures markets to price future contracts at a premium to spot prices, a condition known as contango. In markets like those for commodities or volatility indexes, where this phenomenon is prevalent, the strategy involves taking positions that benefit from the gradual decline in the price of futures contracts as they converge to the spot price over time. For volatility-based products, especially, this strategy typically involves short selling or employing derivative positions that gain value as the underlying futures contracts decrease in price due to their roll costs. By capitalizing on the predictable loss incurred from holding futures in a contango market, traders aim to generate profits from the natural decay of these contracts' value, making it a tactical approach for exploiting structural inefficiencies in certain financial markets.
DATA INFO:
The strategy uses daily data from the UVXY ETF
5. The Rules
The strategy consists of several rules for deciding when to buy (enter) or sell (exit) stocks. These rules are based on technical indicators, primarily focusing on the Average True Range indicator (ATR) and the Relative Strength Indicator (RSI).
Entry Criteria:
- RSI Overbought Entry: Establish a short position when no open position exists and the 4-day closing RSI exceeds its upper threshold level. This indicates the asset is rallying, potentially ripe for a downturn, making it an opportune moment for shorting.
Profit and Risk Controls:
- ATR Profit Taking: Close out short positions for a profit when the closing price is below the entry price by at least two times the 20-day Average True Range (ATR). This rule targets profits by leveraging the volatility indicator to capture favorable moves.
- Mandatory Stop Loss: Implement a compulsory stop-loss order to exit a short position if the price reaches twice the entry price, a crucial step to mitigate significant losses from unexpected market rallies.
Re-engagement After Profit:
- Profit-Driven Re-entry: Following a profitable exit, re-initiate a short position at the next day’s market price. This component of the strategy seeks to reinvest profits by re-entering under conditions that previously led to successful outcomes.

This structured approach employs technical indicators for strategic entries and exits, focusing on capitalising on contango effects within volatility ETFs. It balances the pursuit of profit with a stringent risk management framework, incorporating specific indicators like the RSI for entries and the ATR for profit-focused exits, ensuring traders can navigate the complexities of the market while aiming for sustained profitability.
6. How it Works in Practice
Remember, while strategies like Contango can provide great trade setups, they're not foolproof. Market conditions can at times be unfavorable, and risk management is crucial. Always be prepared for the possibility of loss.

IDENTIFY OPPORTUNITY
Use the rules to find a setup according to the strategy’s criteria.

ENTER THE TRADE:
Short sell UVXY when it meets the entry conditions.

SET PROFIT TARGET
Know in advance what the profit target is, based on the strategy’s profit target rule.

EXIT STRATEGY:
Buy back the stock when it reaches the profit target or if any conditions suggest it’s time to exit to minimise losses.

LEVERAGE IS NOT RECOMMENDED
Leveraging this strategy is extremely risky, period. An initial allocation is less than 5% of your total portfolio is suggested.

OUTSOURCE YOUR TRADE EXECUTION
This strategy is fully mechanical which allows you to outsource the management of the strategy on your account to MyTradingAdvisor. MTA will monitor the system on a day to day basis and execute the orders for the system on your account according to the terms and condition in the Strategy Execution Document.
7. Risk Management
Risk management is a foundational component of any successful trading strategy, especially when dealing with leveraged ETFs like UVXY, which are inherently more volatile than many other financial instruments. Utilising stop losses is a critical risk management tool within this strategy. Stop losses help to limit potential losses by automatically exiting a position at a predefined price level, thereby protecting the trader from significant and unexpected market downturns. This is particularly vital in bear markets or during market crashes, such as those experienced during the Global Financial Crisis (GFC) or the COVID-19 pandemic, where rapid and steep declines in market value can occur. Without adequate stop losses in place, traders might face substantial losses that could be difficult to recover from, as positions could quickly move against them far more than anticipated.
The suggestion to allocate 5% or less of a total portfolio to this strategy is grounded in the principles of diversification and exposure limitation. Leveraged ETFs, by their nature, can exhibit extreme volatility and thus carry a higher risk of loss. In periods of market turmoil, like the GFC or the COVID-19 market crash, even well-thought-out strategies can face unprecedented challenges. Markets can move swiftly and unpredictably, rendering typical patterns and historical behaviors unreliable. By limiting exposure to a small fraction of the portfolio, traders can engage with this higher-risk strategy without jeopardizing their overall financial health. This conservative allocation acts as a buffer, ensuring that even if the strategy encounters a worst-case scenario, the bulk of the portfolio remains intact and diversified across less volatile assets.
Moreover, the strategic use of stop losses within this context not only serves to protect the trader from excessive losses but also underscores the importance of disciplined trading. In the face of extreme market events, stop losses can prevent emotional decision-making and compel adherence to a predetermined exit strategy. However, it’s essential to recognize that stop losses in highly volatile or fast-moving markets may not always execute at the expected price level, leading to slippage. Hence, a modest allocation to the strategy further mitigates the risk of such occurrences disproportionately impacting the trader’s overall portfolio. This careful approach to allocation, combined with the disciplined use of stop losses, enables traders to navigate through tumultuous markets, protecting against the kind of severe downturns seen during the GFC or the COVID-19 pandemic while still allowing for potential upside from the volatility strategy.
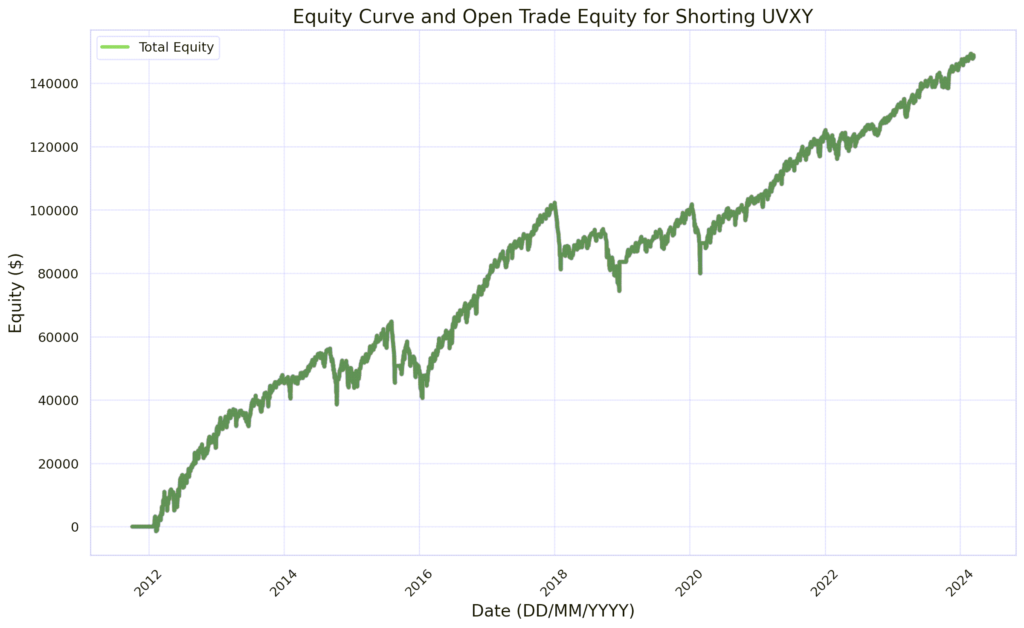
8. Strategy Statistics
The table below presents key performance statistics of a trading strategy, offering a clear, quantitative snapshot of its historical profitability, risk, and consistency. By displaying data such as net profit, drawdowns, win/loss ratios, and Sharpe ratios, traders can evaluate the strategy's effectiveness and make informed investment decisions. The statistics show results from 2013 to the 27th March 2024 for entering a short position of US$10,000 per trade.
| Overall | Monthly Profit Analysis | Winning Trades | Losing Trades | Statistics |
|---|---|---|---|---|
| Total Net Profit: $157215.40 | Average Monthly Profit: $1,257.72 | Total Winners: 114 | Total Losers: 5 | Profit Factor (Wins/Losses): 5.93 |
| Total Trades: 119 | Monthly Sharpe Ratio: 0.43 | Gross Profit: $215,601.80 | Gross Loss: $-58,386.44 | Winning Percentage: 95.9% |
| Max Closed-out Drawdown: $-12,021.86 | Std Dev of Monthly Profits: $2,376.00 | Average Win: $1,724.81 | Average Loss: $-11,677.29 | Payoff Ratio (AvgWin/AvgLoss): 0.14 |
| Max Intra-trade Drawdown: $-16,980.00 | Annualized Sharpe Ratio: 1.50 | Largest Win: $4,382.39 | Largest Loss: $-12,021.86 | CPC Index (Pfx W in% x PR): 1.44 |
| Account Size Required: $26,980 | Calmar Ratio: 0.92 | Largest Drawdown in Win: $-16,080.00 | Largest Peak in Loss: $2,015.00 | Expectancy (Avg Trade/Win/Loss):20.22% |
| Open Equity: $696.00 | Avg Run Up in Win: $2,337.00 | Avg Peak in Loss: $1,210.00 | Return Pct: 582% | |
| Percent in the Market: 90.4% | Avg Run Down in Win: $-221.00 | Avg Run Up in Loss: $145.00 | Kelly Pct (AvgTrade/AvgWin): 79.74% | |
| Avg # of Bars in Trade: 22.93 | Most Consec Wins: 49 | Avg Run Down in Loss: $-1,210.00 | Z-Score: 1.1 | |
| Avg # of Trades per Year: 9.9 | Avg # of Consec Wins:19.5 | Most Consec Losses: 1 | Optimal f (W/L Predictability): 0.83 | |
| Avg # of Bars in Wins: 22.48 | Avg # of Consec Losses: 1.00 | Current Streak: 49 Wins | ||
| Avg # of Bars in Losses: 33.40 |
OVERALL PERFORMANCE
Total Net Profit: $157,215.40 – This represents the overall profit made after accounting for all gains and losses.
Average Monthly Profit: $1,257.72 – The average profit earned per month.
Total Winners: 114 – The total number of trades that resulted in a profit.
Total Losers: 5 – The total number of trades that resulted in a loss.
Profit Factor (Wins/Losses): 5.93 – A ratio of total wins to total losses, indicating overall profitability.
Total Trades: 119 – The total number of trades executed.
Monthly Sharpe Ratio: 0.43 – Measures the risk-adjusted return, indicating how much excess return is received for the extra volatility endured holding a riskier asset.
Gross Profit: $215,601.80 – The total profit before deducting any losses.
Gross Loss: -$58,386.44 – The total amount lost before accounting for any gains.
Winning Percentage: 95.9% – The percentage of trades that were profitable.
Max Closed-out Drawdown: -$12,021.86 – The largest loss from a peak to trough before a new peak is attained, based on closed trades.
Std Dev of Monthly Profits: $2,376.00 – Standard deviation of monthly profits, indicating volatility.
Average Win: $1,724.81 – The average profit from winning trades.
Average Loss: -$11,677.29 – The average loss from losing trades.
Payoff Ratio (AvgWin/AvgLoss): 0.14 – The ratio of average win size to average loss size.
Max Intra-trade Drawdown: -$16,980.00 – The largest drop in value during a trade before it’s closed.
Annualized Sharpe Ratio: 1.50 – The Sharpe Ratio calculated on an annual basis.
Largest Win: $4,382.39 – The highest profit from a single trade.
Largest Loss: -$12,021.86 – The biggest loss from a single trade.
CPC Index: 1.44 – Possibly a custom metric, typically involving aspects like profitability, consistency, and performance.
Account Size Required: $26,980 – The recommended minimum account size to follow this trading strategy.
Calmar Ratio: 0.92 – A measure of the risk-adjusted return that uses the maximum drawdown as the risk measure.
Expectancy: 20.22% – The average amount you can expect to win or lose per trade.
Open Equity: $696.00 – The current unrealized profit or loss.
Percent in the Market: 90.4% – The percentage of time the trading strategy is in a trade.
Kelly Pct: 79.74% – The Kelly Criterion percentage, indicating the optimal amount of capital to allocate to each trade.
Z-Score: 1.1 – Indicates the number of standard deviations a datapoint is from the mean, used here possibly to assess the probability of streaks.
Optimal f: 0.83 – A money management strategy metric indicating the optimal fraction of capital to wager.

SUMMARY
These fields provide a comprehensive overview of the trading performance, including profitability metrics, risk assessment, and trade statistics. The system performs strongly in markets with declining volatility and poorly when volatility spikes.
9. Examples
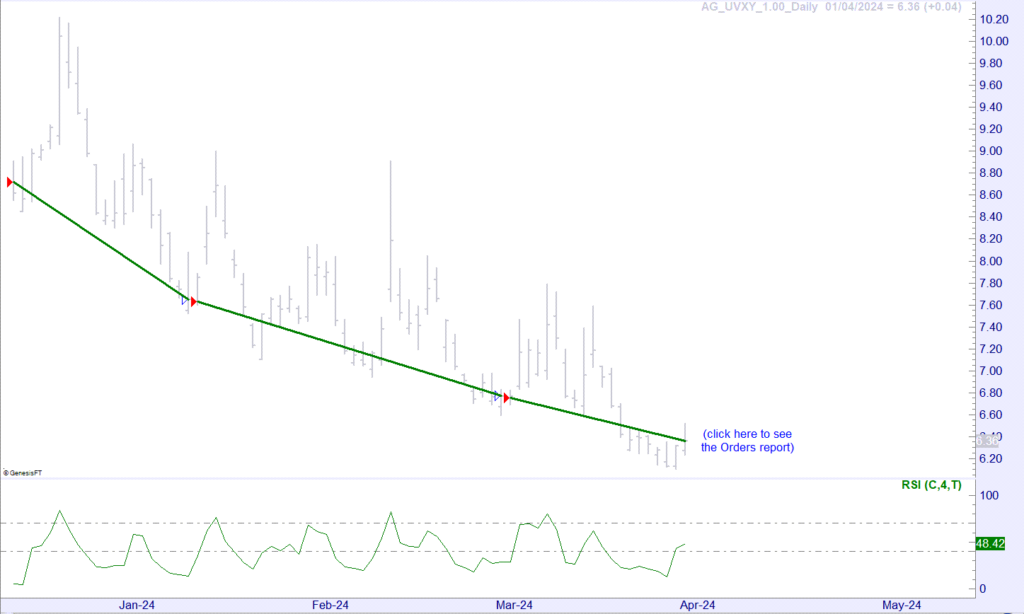
Trade Example#1 – UVXY
Trade #1
- Short Entry on the 13th of December 2023 at $8.72
- Short Exit on 11th of January 2024 at $7.65
- Result: Profit of $1.07 or 12.27%
Trade #2
- Short Entry on the 12th of January 2024 at $7.63
- Short Exit on the 1st of March 2024 at $6.77
- Result: Profit of $0.86 or 11.27%
Trade #3
- Short Entry on the 4th of March 2024 at $6.75
- Current Position trading at $6.36 as at 2nd of April 2024
- Result: Open trade profit of $0.39 or 5.77%
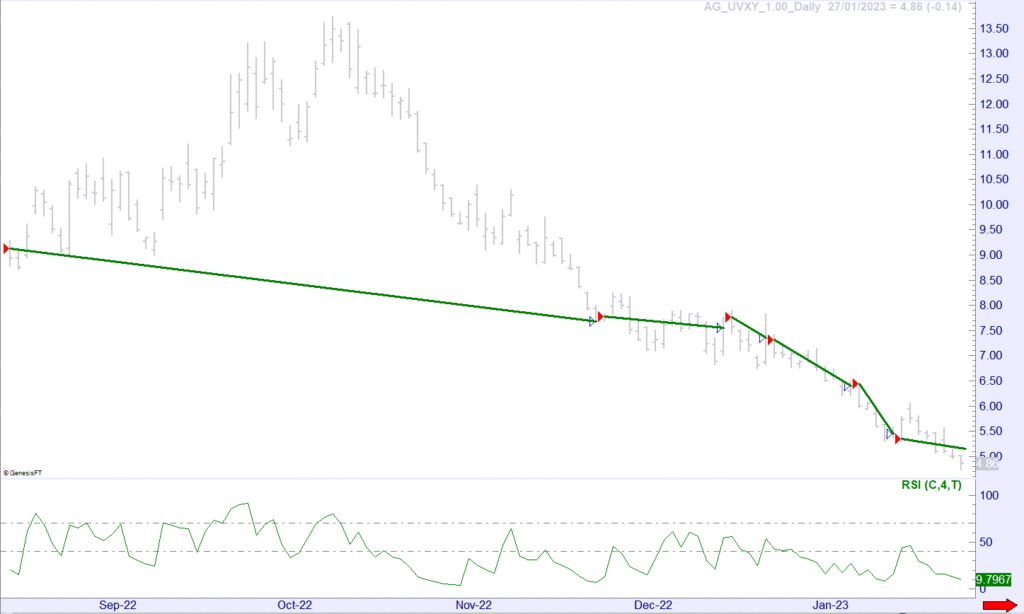
Trade Example#2 – UVXY
Trade #1
- Short Entry on the 17th of August 2022 at $9.13
- Short Exit on the 23rd of November 2022 at $7.68
- Result: Profit of $1.45 or 15.88%
Trade #2
- Short Entry on the 25th of November 2022 at $7.78
- Short Exit on the 15th of December 2022 at $7.55
- Result: Profit of $0.23 or 2.95%
Trade #3
- Short Entry on the 16th of December 2022 at $7.77
- Short Exit on the 22nd of December 2022 at $7.35
- Result: Profit of $0.42 or 5.40%
Trade #4
- Short Entry on the 23rd of December 2022 at $7.32
- Short Exit on the 9th of January 2023 at $6.40
- Result: Profit of $0.92 or 12.57%
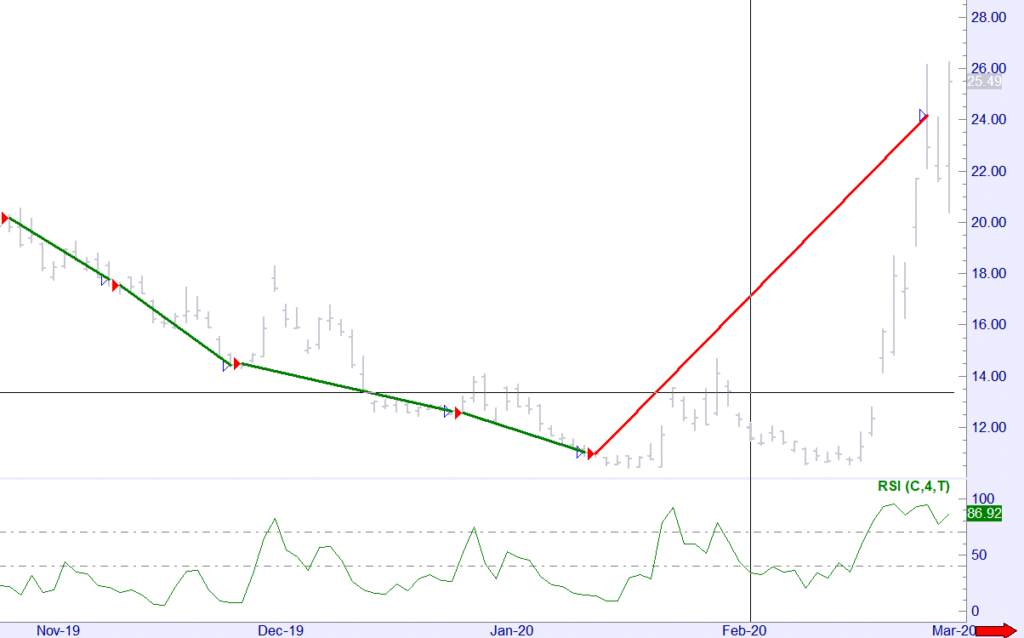
Trade Example#3 – UVXY
Trade #1
- Short Entry on the 29th of October 2019 at $20.15
- Short Exit on the 11th of November 2019 at $17.78
- Result: Profit of $2.37 or 11.76%
Trade #2
- Short Entry on the 12th of November 2019 at $17.53
- Short Exit on the 26 of November 2019 at $14.43
- Result: Loss of $3.10 or 17.48%
Trade #3
- Short Entry on the 27th of November 2019 at $14.48
- Short Exit on the 26th of December 2019 at $12.64
- Result: Loss of $1.84 or 12.70%
Trade #4
- Short Entry on the 27th of December 2019 at $12.55
- Short Exit on the 14th of January 2020 at $11.03
- Result: Loss of $1.52 or 12.11%
Trade #5
- Short Entry on the 15th of January 2020 at $10.98
- Short Exit on the 28th February 24.18 at $24.18
- Result: Loss of $13.20 or -120.21%
TO PROCEED CLICK "SIGN UP NOW"
The Contango Strategy is a robust system, with the rules showing a strong historical positive expectancy. For traders seeking to amplify their investment portfolios this strategy is particularly enticing due to its strong performance metrics.
Investors interested in a disciplined and tested approach to trading, with clear historical evidence of success, should consider the Contango Strategy as a compelling option for their short-term trading endeavours. It’s an opportunity to participate in a robust strategy that has the potential to demonstrate resilience and profitability over time.
To have this strategy executed for you on your trading account please select the ‘Sign Up Now” button below to proceed. On the next page you will be asked for your name, email and phone number. We will check to see if you have an existing account, if so we will send you our Strategy Execution Agreement. If not we will help you to open an account with Interactive Brokers, which will be linked to MTA so we are able to execute trade on your account once funded.