BOOSTER Q
Betting Against Tech Volatility: Shorting SQQQ Capitalises on Sector Stability, Enhancing Portfolio Diversification Strategy
LEVERAGED DECAY FROM DAILY REBALANCING
- What is Share Trading01
- Key Features of Share Trading02
- Trade Both Long and Short03
- Calculating Profits and/or Losses04
- Share Trading Examples05
- Key Benefits of Shares06
- Margin Lending07
- Risks of Share Trading08
- Styles of Share Trading09
- Tools & Resources10
- How to Open an Account11
- Supported Brokers12
Booster Q Trading System
Booster Q is a system totally executed and supervised by MyTradingAdvisor on your trading account.
Our mission is to help our clients gain exposure to the stock market, without having to do any of the heavy lifting themselves. Best part – there are no joining fees and you can have the opportunity to have a professionally built strategy executed on your account.
1. Introducing Booster Q
Maximise Inverse ETF Returns: Strategic SQQQ Shorting Utilising Volatility and Overbought Conditions for Calculated Risk Management and Enhanced Profit Potential.
Booster Q harnesses the inherent volatility of the market by taking short positions on SQQQ, an inverse leveraged ETF that aims to deliver three times the inverse performance of the NASDAQ-100 Index. Given SQQQ rises in value when the NASDAQ-100 falls, shorting SQQQ is essentially a bet on the growth and resilience of the tech-heavy index. This strategy is crafted for those who anticipate strength in the technology sector, seeking to profit from the ETF’s potential declines during market upswings.
By shorting SQQQ, Booster Q offers investors an innovative way to leverage positive market trends, particularly within the technology sector. It’s an approach that turns traditional investment strategies on their head, focusing on earning gains from the expected upward trajectory of tech stocks rather than direct downturns. This method presents a unique angle for investors to diversify their portfolios, adding a layer of sophistication and counterbalance to conventional long positions in a bullish market environment.
Implementing Booster Q requires a keen understanding of market dynamics and the ability to predict shifts in the technology sector’s performance. It’s designed for investors looking to actively manage their risk while capitalising on the growth of the NASDAQ-100. This strategy is not just about shorting an ETF; it’s about strategically positioning oneself to benefit from the enduring strength of tech stocks, making volatility a friend rather than a foe in the pursuit of portfolio enhancement.
| Booster Q | Details |
|---|---|
| Minimum Investment | US$10,000 |
| Market | ProShares UltraPro Short QQQ ETF |
| Average Trade | 17.74% |
| Average Trade Length | 10 Weeks |
| Percentage Winning Trades | 96.7% |
| Win:Loss Ratio | 0.17 to 345.74 |
2. Why the Nasdaq 100 Stocks?
Booster Q is a strategic investment approach that targets short positions on SQQQ, leveraging the growth potential of the NASDAQ-100 Index. By betting against this inverse leveraged ETF, investors position themselves to capitalise on the anticipated upward movement of technology and large-cap stocks within the index. This strategy is particularly suited for those who foresee a bullish trend in the tech sector, offering a nuanced way to benefit from market advancements without direct exposure to individual stock risks. It embodies a sophisticated blend of risk management and growth strategy, aiming to enhance portfolio returns through careful market analysis and timing.
KEY POINTS:
1
Tech Sector Growth:
Shorting SQQQ aligns with positive forecasts for the technology sector, exploiting the ETF’s inverse relationship with the NASDAQ-100’s performance.
2
Market Volatility Leverage:
The strategy utilises the leveraged nature of SQQQ to magnify potential gains from short positions during periods of market growth.
3
Risk Management:
Offers an alternative method for portfolio diversification and risk reduction, especially in volatile market conditions.
4
Counterbalance Strategy:
Acts as a counterbalance to traditional long positions, providing a hedge against potential downturns in other portfolio investments.
5
Strategic Positioning:
Enables investors to take a nuanced position on the overall market trend, especially within the tech sector, without direct stock holdings.
6
Enhanced Portfolio Returns:
Aims to boost portfolio performance through strategic bets on the broader market’s direction, capitalising on the dynamics of leveraged inverse ETFs.
3. Strategic Considerations
In the context of the Booster Q strategy, the application of a nuanced technical analysis framework facilitates a disciplined approach to trading, especially when navigating the intricacies of shorting SQQQ. This strategy integrates volatility and momentum indicators to strategically enter and exit trades, optimizing for market conditions that historically precede movements beneficial to short positions. Key to this approach is leveraging the Average True Range (ATR) to gauge market volatility and set thresholds for trade execution, ensuring decisions are aligned with current market dynamics. The use of ATR factors to determine exit points underscores a commitment to risk management, allowing for the adaptation to sudden market shifts and protecting against undue losses.
Momentum indicators, particularly the Relative Strength Index (RSI), serve as a cornerstone for identifying entry points. By assessing conditions that may indicate an overextended market—thereby ripe for a reversal—this strategy capitalises on the potential for the NASDAQ-100 to bounce back from periods of underperformance. This is critical in the context of shorting SQQQ, as it seeks to exploit the anticipated recovery of the index. Such a methodology underscores the importance of timing in trade execution, leveraging historical price action to forecast future movements.

Furthermore, a well-defined stop-loss strategy forms an integral part of this trading framework, ensuring that each position is safeguarded against excessive losses. This involves setting predetermined exit points based on multiple factors, including the entry price and a tailored stop-loss multiplier, to manage the risk associated with each trade actively. Such a comprehensive approach to risk management, combined with strategic entry and exit based on volatility and momentum, defines the Booster Q strategy. It highlights an astute application of technical analysis designed to navigate the complexities of shorting leveraged inverse ETFs, aiming to secure profits while minimizing exposure to volatility-driven downturns.
4. What is the Booster Q Strategy:
The Booster Q Strategy focuses on shorting SQQQ through technical analysis, using volatility and momentum indicators to determine when to enter and exit trades. It leverages the Average True Range and Relative Strength Index to spot opportunities against NASDAQ-100 movements, incorporating strict risk management with stop-loss orders to minimise losses. This strategy is tailored for investors aiming to profit from the inverse performance of SQQQ in a calculated, risk-aware manner.
5. The Rules
The Booster Q Strategy uses three main rules to decide when to short SQQQ, aiming to make a profit by betting on declines in its value. Here's a breakdown of each rule:
- Overbought 1 (Short Entry): This rule tells us when it might be a good time to start a short position. If SQQQ’s price is much higher than its lowest point in the last 50 days, adjusted for extreme volatility, it’s considered overbought—meaning it’s probably going to start going down soon. That’s our cue to speculate on its decline by shorting it.
- AVG True Range Exit (Short Exit): Now, for deciding when to exit our short position. If SQQQ’s price drops significantly below its highest point since we entered the trade, it’s a signal that our trade was correct, and it might be time to close the position to lock in our profits. This rule uses a volatility measure to help decide a smart exit point.
- Stop Loss (Short Exit): This is our safety net. It means if our trade goes wrong and SQQQ’s price starts to rise instead of fall, we limit our losses by setting a predetermined price level at which we’ll exit the trade. This rule ensures we don’t lose more than we’re prepared to, protecting us from significant financial hits if the market moves against us.

6. How it Works in Practice
Remember, while strategies like Booster Q can provide great trade setups, it's not foolproof. Market conditions can at times be unfavorable, and risk management is crucial. Always be prepared for the possibility of loss.

IDENTIFY OPPORTUNITY
Use the rules to find when SQQQ has an entry setup.

ENTER THE TRADE:
Short Sell SQQQ when it meets the entry conditions.

SET PROFIT TARGET
Know in advance what the profit target is, based on the strategy’s profit target rule.

EXIT STRATEGY:
Buy back the position when it reaches the profit target or if any conditions suggest it’s time to exit to minimise losses.

LEVERAGE
Leverage is inherent within the SQQQ instrument.

OUTSOURCE YOUR TRADE EXECUTION
This strategy is fully mechanical which allows you to outsource the management of the strategy on your account to MyTradingAdvisor. MTA will monitor the system on a day to day basis and execute the orders for the system on your account according to the terms and condition in the Strategy Execution Document.
7. Risk Management
In relation to the Booster Q strategy, risk management plays a pivotal role, particularly because dealing with leveraged inverse ETFs like SQQQ involves higher volatility and potential for rapid changes in value. The strategy employs specific risk management techniques to safeguard investments. One such technique involves setting stop-loss orders based on predefined criteria to automatically exit positions that move against the trader’s anticipation, thereby limiting potential losses and protecting the investment capital from significant downturns.
Moreover, the Booster Q strategy’s use of technical analysis, through indicators like the Average True Range (ATR) and the Relative Strength Index (RSI), aids in making informed decisions about when to enter and exit trades. This approach helps manage risk by ensuring that entry and exit points are based on historical volatility and price momentum, aiming to optimize the timing of trades to avoid entering or exiting positions at inopportune moments.
Diversification within the context of the Booster Q strategy also plays a role in risk management. While the strategy focuses on shorting SQQQ, it is important for investors to balance their portfolios across different asset classes and investment strategies. This diversification helps spread risk and reduce the impact of a poor performance in any single investment on the overall portfolio.
Lastly, continuous monitoring and analysis are crucial. The financial markets are dynamic, and conditions can change rapidly. By staying informed and being ready to adjust strategy parameters in response to market movements, traders can manage risk more effectively. This proactive approach enables traders to respond to volatility, adjust their risk threshold, and protect their investments against unforeseen market shifts, aligning with the overall objective of maximising returns while minimizing losses within the Booster Q strategy.
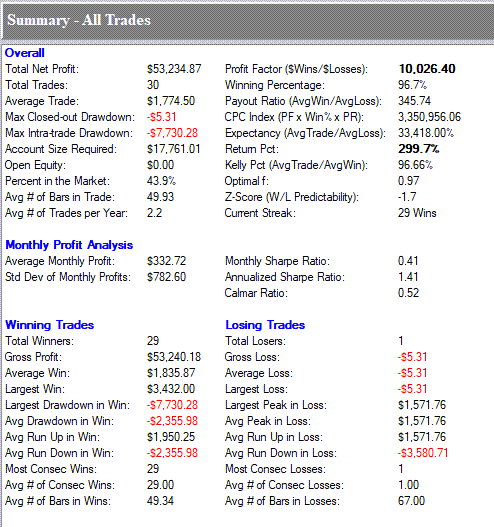
8. Strategy Statistics
Presenting trading statistics for the Booster Q strategy serves to validate its performance and demonstrate its effectiveness in managing risk while generating profits. The detailed metrics provide transparency, showing potential investors not only the high win rate and net gains but also how the strategy performs under different market conditions. This data offers insights into the strategy's robustness, efficiency in capital utilisation, the consistency of returns, and the overall risk exposure, which are crucial for informed decision-making and building investor confidence.
Equity Curve
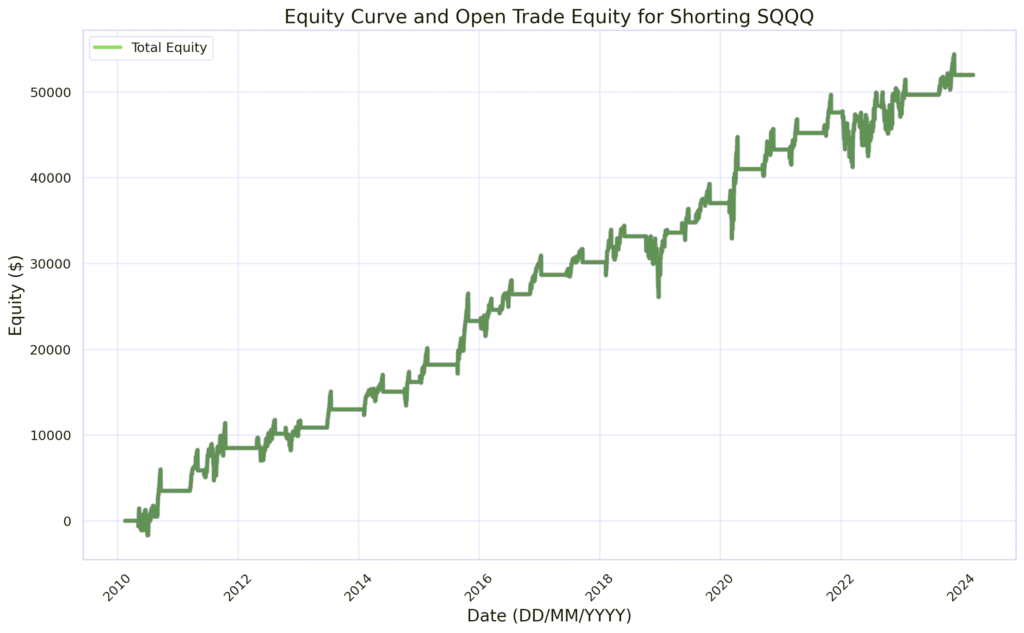
The graph above shows equity curve for entering a short position with a face value of $10,000 USD and incudes open trade profit or loss. The date range is from January 1st 2010 to the 27th February 2024.
OVERALL PERFORMANCE
- Assumptions: Trade Size: $10,000 per trade. All figures in USD.
- Total Net Profit: $53,234.87 – Total earnings after subtracting losses.
- Total Trades: 30 – Total number of trades executed.
- Average Trade: $1,774.50 – Average profit per trade.
- Max Closed-out Drawdown: $5.31 – Largest decrease in account value.
- Max Intra-trade Drawdown: $7,730.28 – Largest drop within a trade.
- Account Size Required: $17,761.01 – Minimum capital needed to trade.
- Open Equity: $0.00 – Value of open positions.
- Percent in the Market: 43.9% – Time spent with active trades.
- Avg # of Bars in Trade: 49.93 – Average duration of trades in bars.
- Avg # of Trades per Year: 2.2 – Average frequency of trades per year.

MONTHLY PROFIT ANALYSIS
- Average Monthly Profit: The average profit made per month, $9,086.36 assuming all trades taken.
- Std Dev of Monthly Profits: The standard deviation of monthly profits, indicating volatility in monthly returns, $12,216.74 assuming all trades taken.

WINNING VS. LOSING TRADES
- Total Winners: 29 – Number of profitable trades.
- Total Losers: 1 – Number of unprofitable trades.
- Gross Profit: $53,240.18 – Total from profitable trades.
- Gross Loss: -$5.31 – Total from unprofitable trades.
- Largest Win: $1,835.87 – Single biggest profit from a trade.
- Largest Loss: -$5.31 – Single biggest loss from a trade.
- Avg Peak in Win: $1,571.76 – Average highest profit point in winning trades.
- Avg Run Down in Loss: $3,580.71 – Average lowest point before a loss is realised.
- Most Consecutive Wins: 29 – Longest winning streak.
- Most Consecutive Losses: 1 – Longest losing streak.
- Avg # of Bars in Wins: 49.34 – Average duration of winning trades in bars.
- Avg # of Bars in Losses: 67.00 – Duration of the losing trade in bars.

RISK METRICS
- Profit Factor (Wins/Losses): 10,026.40 – Ratio of total wins to losses.
- Winning Percentage: 96.7% – Percentage of profitable trades.
- Payout Ratio (Avg Win/Avg Loss): 345.74 – Average win size relative to loss size.
- Expectancy (Avg Trade/Avg Loss): 33,418.00% – Expected return for each dollar risked.
- Return Pct: 299.7% – Percentage of return on account size.
- Kelly Pct: 96.67% – Optimal portion of capital to risk according to Kelly criterion.
- Z-Score (W/L Predictability): -1.7 – Statistical measure of win-loss pattern.
- Current Streak: 29 Wins – Consecutive winning trades.
- Average Monthly Profit: $332.72 – Average profit per month.
- Std Dev of Monthly Profits: $782.60 – Standard deviation of monthly profits, a volatility measure.
- Monthly Sharpe Ratio: 0.41 – Risk-adjusted return measure.
- Annualized Sharpe Ratio: 1.41 – Annualized measure of risk-adjusted return.
- Calmar Ratio: 0.52 – Ratio of average annual return to the maximum drawdown.

SUMMARY
The strategy yielded a robust net profit of $53,234.87 with a 96.7% win rate over 30 trades, and managed risks with a moderate maximum drawdown, indicating effective profitability and risk control.
9. Examples
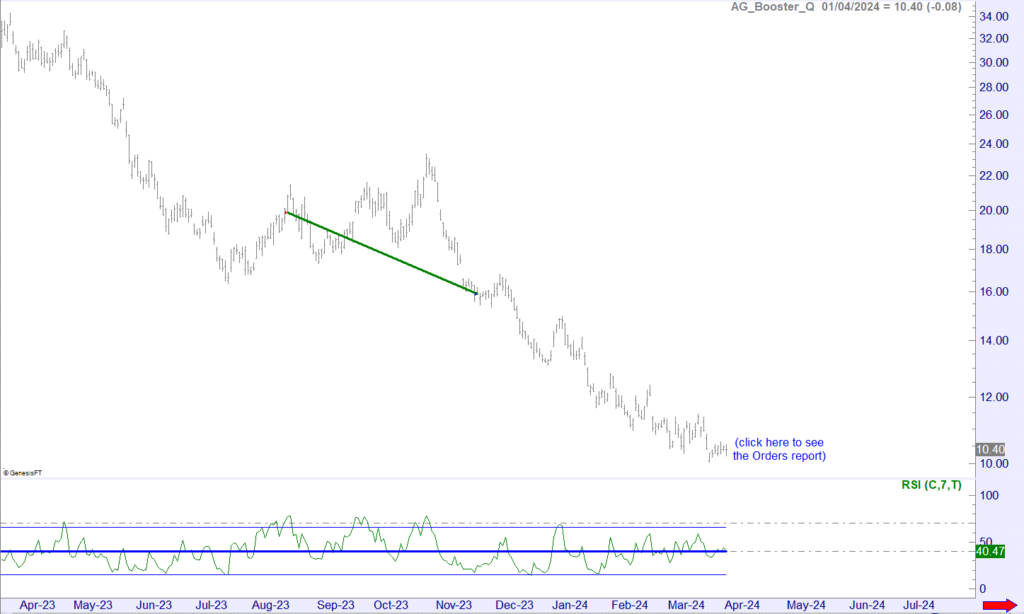
Trade Example#1 – SQQQ
Trade #1
- Short Entry on the 17th August 2023 at $19.89
- Short Exit on the 21st of November 2023 at $15.99
- Result: Profit of $3.90 or 19.60%
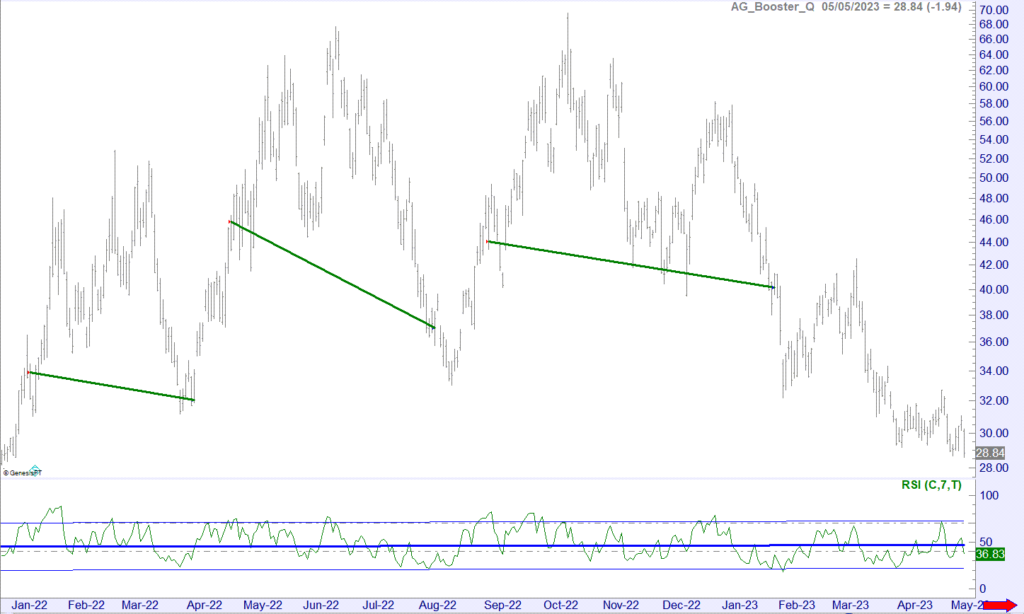
Trade Example#2 – SQQQ
Trade #1
- Short Entry on the 11th of January 2022 at $33.90 (back adjusted price)
- Short Exit on the 5th of April 2022 at $32.07
- Result: Profit of $1.83 or 5.39%
Trade #2
- Short Entry on the 25th of April 2022 at $45.84
- Short Exit on the 8th of August 2022 at $37.05
- Result: Profit of $8.79 or 19.17%
Trade #3
- Short Entry on the 2nd of September 2022 at $44.01
- Short Exit on the 30th of January 2023 at $40.15
- Result: Profit of $3.86 or 8.77%
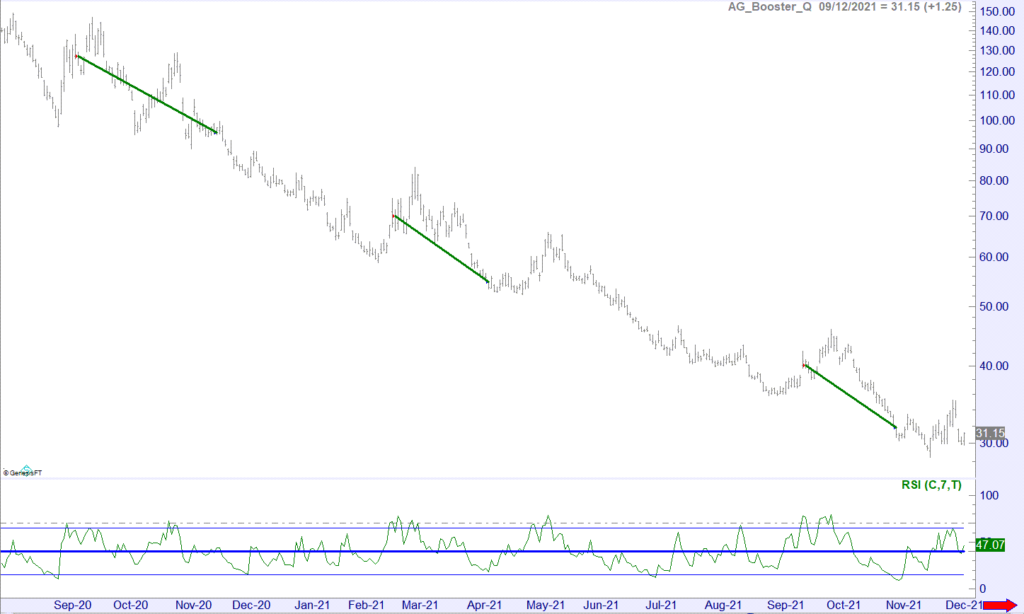
Trade Example#3 – SQQQ
Note that prices have been back-adjusted for stock splits in the examples below.
Trade #1 –
- Short Entry on the 14th of September 2020 at $127.10
- Short Exit on the 20th November 2020 at $95.50
- Result: Profit of $31.60 or 24.86%
Trade #2
- Short Entry on the 24th of February 2021 at $70.00
- Short Exit on the 13th of April 2021 at $54.75
- Result: Profit of $15.25 or 21.78%
Trade #3
- Short Entry on the 21st of September 2021 at $40.10
- Short Exit on the 4th of November 2021 at $31.80
- Result: Profit of $8.30 or 20.69%
TO PROCEED CLICK "SIGN UP NOW"
The Booster Q Strategy is a robust system, with the rules showing a strong historical positive expectancy. For traders seeking to amplify their investment portfolios this strategy is particularly enticing due to its strong performance metrics.
Investors interested in a disciplined and tested approach to trading, with clear historical evidence of success, should consider the Booster Q Strategy as a compelling option for their short-term trading endeavours. It’s an opportunity to participate in a robust strategy that has the potential to demonstrate resilience and profitability over time.
To have this strategy executed for you on your trading account please select the ‘Sign Up Now” button below to proceed. On the next page you will be asked for your name, email and phone number. We will check to see if you have an existing account, if so we will send you our Strategy Execution Agreement. If not we will help you to open an account with Interactive Brokers, which will be linked to MTA so we are able to execute trade on your account once funded.