BREAKOUT
Breakout System: Strategically Master the ASX 200 with a Proven, Structured Trading System
TREND FOLLOWING ON THE ASX 200 STOCKS
- What is Share Trading01
- Key Features of Share Trading02
- Trade Both Long and Short03
- Calculating Profits and/or Losses04
- Share Trading Examples05
- Key Benefits of Shares06
- Margin Lending07
- Risks of Share Trading08
- Styles of Share Trading09
- Tools & Resources10
- How to Open an Account11
- Supported Brokers12
Breakout Trading System
Breakout is a system totally executed and supervised by MTA on your trading account.
Our mission is to help our clients gain exposure to the stock market, without having to do any of the heavy lifting themselves. Best part – there are no joining fees and you can have the opportunity to have a professionally built strategy executed on your account.
1. Introducing Breakout
MTA's 'Breakout': A robust Trend-Following System for ASX 200 Stocks.
The “Breakout” system, offered by My Trading Advisor (MTA) for trading ASX 200 stocks, is a mechanical trend-following strategy designed to capitalise on significant movements or “breakouts” from established trading ranges. This system scans the ASX 200 index for stocks that exhibit potential breakout patterns, such as stocks moving above a predefined resistance level, indicating the start of a new trend.
Once a potential breakout is identified, the system automatically initiates a trade with the expectation that the initial movement will continue in the same direction.
My Trading Advisor (MTA) handles the execution and ongoing supervision of the “Breakout” strategy. This includes monitoring open positions for signs of trend continuation or reversal, and implementing predefined exit strategies, such as trailing stops or set profit targets, to protect gains and minimise losses. The system’s mechanical nature ensures that trading decisions are based on consistent criteria, removing emotional biases and enabling efficient execution.
Clients of MTA benefit from this hands-off approach, as it allows them to participate in the potential upside of ASX 200 stocks’ breakout movements without the need to constantly monitor the markets or make complex trading decisions. The “Breakout” system aims to provide a disciplined, systematic approach to capturing trends, backed by the professional oversight and execution capabilities of My Trading Advisor.
| ASX Breakout | Details |
|---|---|
| Minimum Investment | A$50,000 |
| Market | ASX 200 |
| Average Trade | 14.09% |
| Average Trade Length | 31.8 Weeks |
| Percentage Winning Trades | 39.4% |
| Win:Loss Ratio | 4.53 |
2. Why the ASX 200 Stocks?
The ASX 200 Index is a critical stock market index that showcases the performance of 200 of the largest companies listed on the Australian Securities Exchange. It's characterized by a balanced mix of sectors including financials, resources, healthcare, and technology, reflecting the diverse and robust nature of Australia's economy. This index is not only a key indicator of the financial health of Australia's corporate sector but also serves as a gauge for broader economic trends within the country. Companies like Commonwealth Bank, BHP Group, and CSL Limited highlight the index's range, spanning from banking to mining to biotechnology, offering a holistic view of corporate success and sectorial trends in Australia.
KEY POINTS:
1
Broad Exposure to the Australian Economy
Trading the ASX 200 provides investors with exposure to a wide array of sectors, encapsulating the pulse of Australia’s economic and market trends. This offers a concentrated yet diverse portfolio of stocks, presenting high-growth opportunities across different industries.
2
VOLATILITY AND LIQUIDITY
The ASX 200’s constituents are known for their liquidity and, to a certain extent, volatility. This creates numerous trading opportunities, with active trading across a broad range of sectors facilitating effective strategies for both short-term traders and long-term investors.
3
GROWTH POTENTIAL ACROSS SECTORS
With a balanced composition, the ASX 200 often harbors substantial growth prospects. The inclusion of leading companies in traditional and emerging sectors means traders can capitalize on growth as these entities expand and adapt to market and technological changes.
4
DIVERSIFICATION
The diverse sector representation in the ASX 200 allows for risk management through diversification. Investors can engage with high-growth areas while spreading exposure across stable, income-generating sectors.
6
ADAPTABILITY TO MARKET TRENDS
The index is regularly reviewed, ensuring it remains representative of Australia’s largest and most active companies. This dynamic nature means the ASX 200 adapts to changing market landscapes, incorporating rising stars and excluding those that falter, keeping traders aligned with the current economic climate.
3. Strategic Considerations
Trading within the ASX 200 demands an understanding of its broad sectoral composition and the economic factors influencing Australia. The variety in sectors means market movements or global economic shifts can impact the index in complex ways. Additionally, the blend of growth and stability requires balanced risk management and a nuanced approach to market analysis.
For traders, the ASX 200 presents a mix of challenge and opportunity. The potential for significant returns exists alongside the need for careful portfolio management and an awareness of global and domestic economic indicators. By diversifying within the index, keeping abreast of sectoral shifts, and employing strategies mindful of volatility, traders can navigate the complexities of the ASX 200 to potentially achieve substantial gains.

Trading Tip: Engaging with the ASX 200 and its constituents offers traders and investors a comprehensive avenue to participate in the vibrancy of Australia’s economy and the potential growth of its leading companies. With strategic investment and risk management, the ASX 200 can be a gateway to tapping into the robust and diverse economic landscape of Australia.
4. What is the Breakout Strategy:
The "Breakout" strategy is a systematic approach designed for trading ASX 200 stocks, focusing on identifying significant price movements beyond established resistance levels. This strategy combines technical analysis and predefined rules to make buy and sell decisions, aiming to capitalise on the momentum that follows a breakout. Below, we detail the key components and operational guidelines of this strategy:
DATA & INDICATORS:
- The strategy uses price data from ASX 200 stocks, analysing historical high, low, and closing prices.
- Technical indicators such as the Highest High, Lowest Low, Average True Range (ATR), and Keltner Channels are pivotal in identifying trading signals.
5. The Rules
The strategy consists of several rules for deciding when to buy (enter) or sell (exit) stocks.
- Breakout Entry Rule:
- Condition: A position is taken (buy) when there’s no existing position (Position = 0), and the current high price is greater than the highest price over a selected period, and it has been more than 3 bars since the last exit.
- Action: Buy on the next bar at open if it is below the previous days high.
- Purpose: To enter long positions during strong upward momentum, indicating a potential significant price move.
LX Trailing Stop 1 (Long Exit):
- Condition: Sell the existing position if the highest high during the trade is greater than the entry price plus a multiple of the average true range (ATR) and the close is below the lower band of a wide Keltner Channel.
- Action: Sell on the next bar at the market price.
- Purpose: This rule aims to exit long positions when the stock shows signs of reversing after a significant gain, using the Keltner Channel as a volatility and trend indicator.
LX Trailing Stop 2 (Long Exit):
- Condition: Exit a trade when the closing price is greater than the lowest low during the trade plus a higher ATR multiple but is below a tighter lower Keltner Channel band.
- Action: Sell on the next bar at the market price.
- Purpose: To secure profits by setting an ambitious target based on the stock’s volatility, ensuring gains are realized before potential reversal.
Stop Loss Rule:
- Condition: Sell if the closing price falls below the entry price minus five times the ATR (250 days) or falls below 85% of the entry price.
- Action: Sell on the next bar at the market price.
- Purpose: To limit losses by defining clear exit points if the stock moves unfavorably, using the ATR to adjust for stock-specific volatility and a fixed percentage to protect against severe downturns.

6. How it Works in Practice
Remember, while strategies like Breakout can provide great trade setups, they're not foolproof. Market conditions can at times be unfavorable, and risk management is crucial. Always be prepared for the possibility of loss.

IDENTIFY OPPORTUNITY
Use the rules to find stocks that have broken out according to the strategy’s criteria.

ENTER THE TRADE:
Buy the stock when it meets the entry conditions.

SET PROFIT TARGET
Know in advance what the trailing stop is, based on the strategy’s trailing stop rules.

EXIT STRATEGY:
Sell the stock when it reaches the trailing stop level or if any conditions suggest it’s time to exit to minimise losses.

LEVERAGE IS OPTIONAL

OUTSOURCE YOUR TRADE EXECUTION
This strategy is fully mechanical which allows you to outsource the management of the strategy on your account to MyTradingAdvisor. MTA will monitor the system on a day to day basis and execute the orders for the system on your account according to the terms and condition in the Strategy Execution Document.
7. Risk Management
When employing the “Breakout” strategy for risk management, it is advisable to diversify across a portfolio of 5-15 ASX 200 stocks. Diversification dilutes the risk and mitigates the volatility associated with depending on the performance of a solitary or a small cluster of stocks. The goal is to choose stocks that meet the “Breakout” strategy’s criteria, focusing on those within the ASX 200 that demonstrate potential for significant movements.
By engaging with a select group of 5-15 stocks, traders can more effectively manage their exposure to market shifts. This range is manageable for individual traders to closely monitor, ensuring prompt responses to the strategy’s signals and changes in the market. Such diversification allows for investment in various companies, balancing the underperformance of some stocks with the gains of others.
Moreover, this method is in harmony with the “Breakout” strategy’s essence, which seeks to exploit significant price movements. The strategy is designed to take advantage of these movements, capturing gains while managing risks without overly concentrating the investment in a few positions.
In summary, maintaining a diversified portfolio of 5-15 stocks while implementing the “Breakout” strategy is a strategic approach to risk management. It allows traders to remain flexible, maximizing the opportunities presented by the dynamic nature of the ASX 200, while distributing their risk among multiple, judiciously chosen investments.
8. Strategy Statistics
The table below covers the historical performance of the trading system rules from January 1, 2003, to February 19, 2024, assuming a position size of $10,000 per trade in stocks in the ASX200 Index as at the 28th February 2024.
The purpose of providing the system statistics is to help you determine historical profitability for the rules utilised by the system across the spectrum of ASX 200 stocks.
Closed Trade Equity Curve
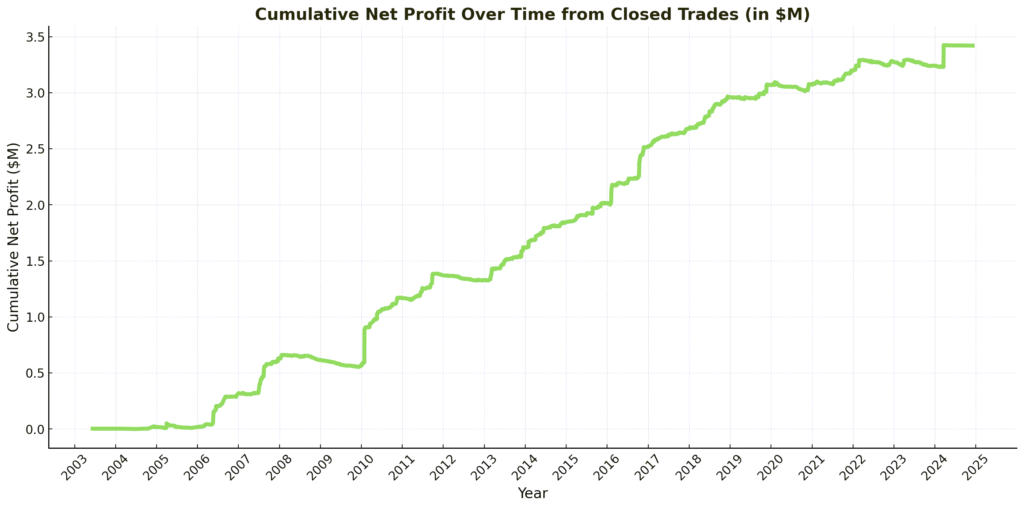
The closed trade equity curve show the results for the Breakout system rules if traded with a fixed A$10,000 per trade from January 1, 2003, to February 19, 2024, on the stocks in the ASX 200 Index as at 28th February 2024.
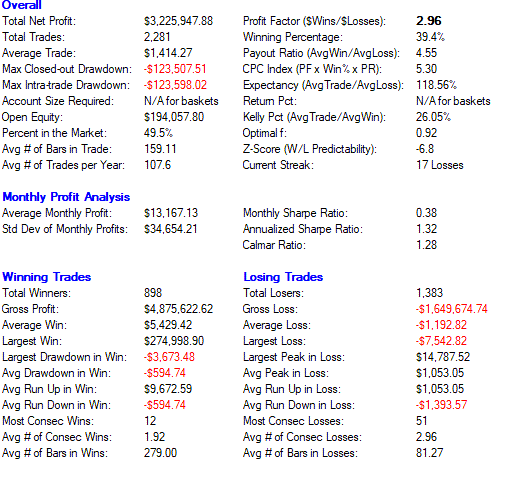
The performance summary of the Breakout trading system serves to analyse results across a variety of ASX 200 stocks, using data reflective of the ASX 200 index constituents. Key metrics for this evaluation include the winning percentage, average trade value, and payout ratio. This summary provides an average profitability measure per trade, recognising the impracticality of engaging in every trade due to account size constraints, which typically cap open trades at 10-20. Hence, these figures should be contextualised accordingly.
OVERALL PERFORMANCE
- Total Net Profit: The strategy yielded a net profit of $3,225,947.88, calculated across all trades with a $10,000 position size from January 1, 2003, to February 28, 2024.
- Total Trades: The strategy executed 2,281 trades during the specified period.
- Average Trade: Each trade averaged a profit of $1,417.52.
- Max Closed-out Drawdown: The largest drop during a closed-out position was $123,507.01.
- Max Intra-trade Drawdown: The maximum recorded drop within a trade was $128,038.52.
- Account Size Required: The strategy did not specify a required account size for basket trading.
- Open Equity: Open positions currently show a profit of $194,057.80.
- Percent in the Market: The system was active in the market 49.5% of the time.
- Avg # of Bars in Trade: Trades lasted an average of 107.6 price bars.
- Avg # of Trades per Year: On average, the strategy took 107.6 trades per year.

MONTHLY PROFIT ANALYSIS
- Average Monthly Profit: The monthly profit average stands at $13,167.13.
- Std Dev of Monthly Profits: Monthly profits showed a standard deviation of $34,654.21.

WINNING VS. LOSING TRADES
Winning Trades
- Total Winners: There were 898 winning trades.
- Gross Profit: Total profit from wins was $4,875,622.62.
- Average Winner: Average profit from a winning trade was $5,429.42.
- Avg # of Bars in Wins: Winning trades were held for an average of 279.00 price bars.
Losing Trades
- Total Losers: There were 1,383 losing trades.
- Gross Loss: Total losses summed up to $1,649,674.74.
- Average Loss: Average loss from a losing trade was $1,192.82.
- Avg # of Bars in Losses: Losing trades lasted an average of 81.27 price bars.

RATIOS AND ADDITIONAL METRICS
- Profit Factor: The strategy’s profit factor is 2.96, indicating profitability.
- Winning Percentage: 39.4% of trades were profitable.
- Payout Ratio: The average win to loss ratio stands at 3.58.
- CPC Index: The CPC Index, which combines win rate and payout ratio, is 5.80.
- Kelly Pct: The Kelly criterion suggests an optimal betting percentage of 26.0%, though practical application recommends a more conservative 5-10%.

PERFORMANCE RATIOS
- Monthly Sharpe Ratio: The risk-adjusted return on a monthly basis is 0.38.
- Annualized Sharpe Ratio: The annualized Sharpe ratio is 1.32.
- Calmar Ratio: The Calmar ratio stands at 1.28.

SUMMARY
This analysis reveals the Breakout system’s robustness and its potential for profitability, taking into account the need for judicious capital allocation and the limitations inherent in active trading accounts.
9. Examples
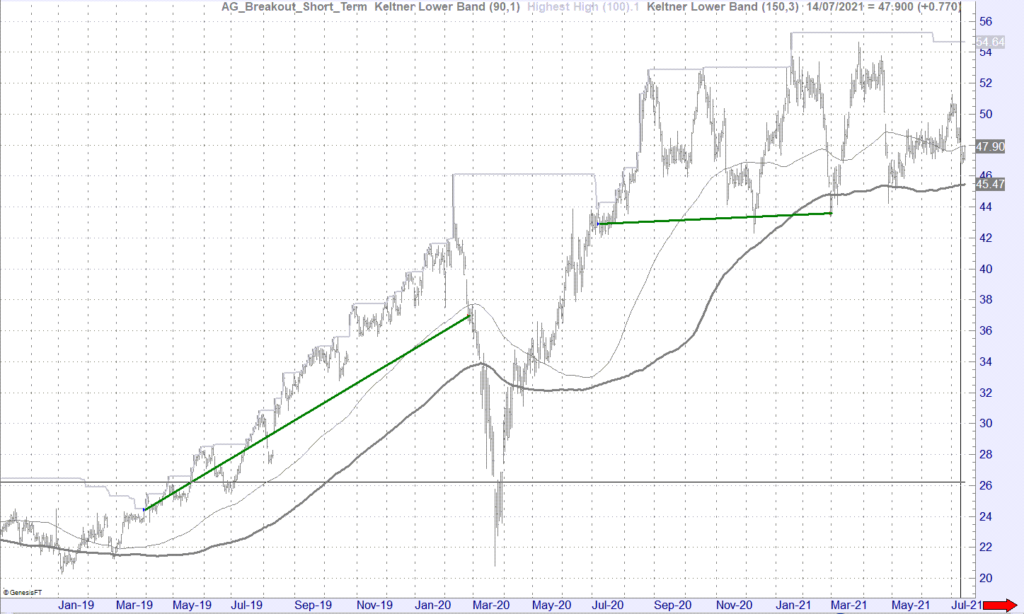
Trade Example#1 – JB HiFi (JBH)
- Entry on the 29th of March 2019 at $24.44
- Exit on the 26th of February 2020 at $36.95
- Result: Profit of $12.51 or 51%
- Entry on the 8th of July 2020 at $42.92
- Exit on the 26th of February 2021 at $44.98
- Result: Profit of 4.84%
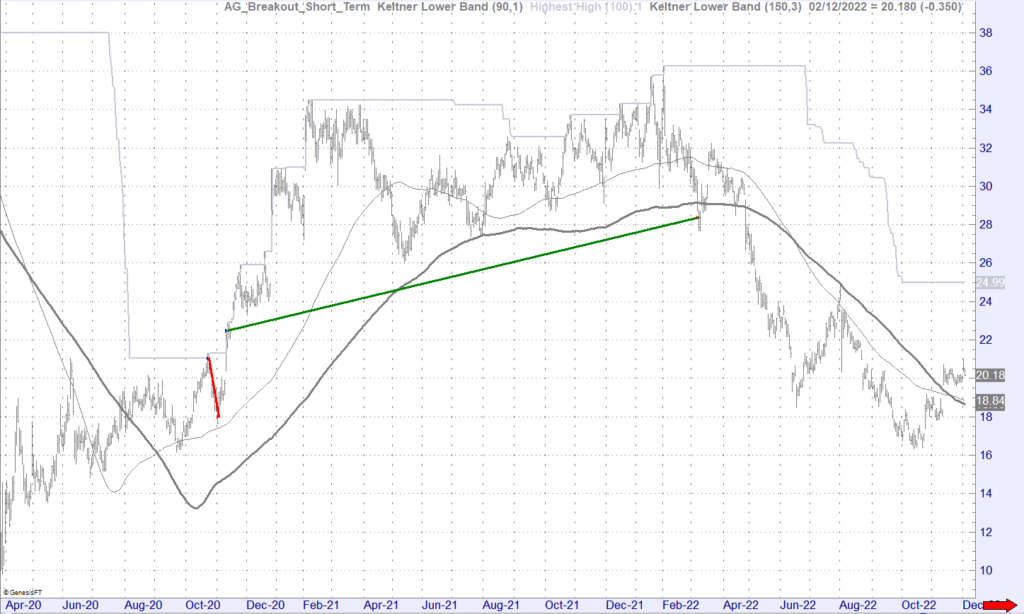
Trade Example#2 – Credit Corp (CCP)
- Entry on the 23rd of October 2020 at $20.54
- Exit on the 3rd of November 2020 at $18.00
- Result: Loss of $2.54 or -12.36%
- Entry on the 11th of November 2020 at $22.48
- Exit on the 8th of March 2022 at $28.39
- Result: Profit of $5.91 or 26.29%
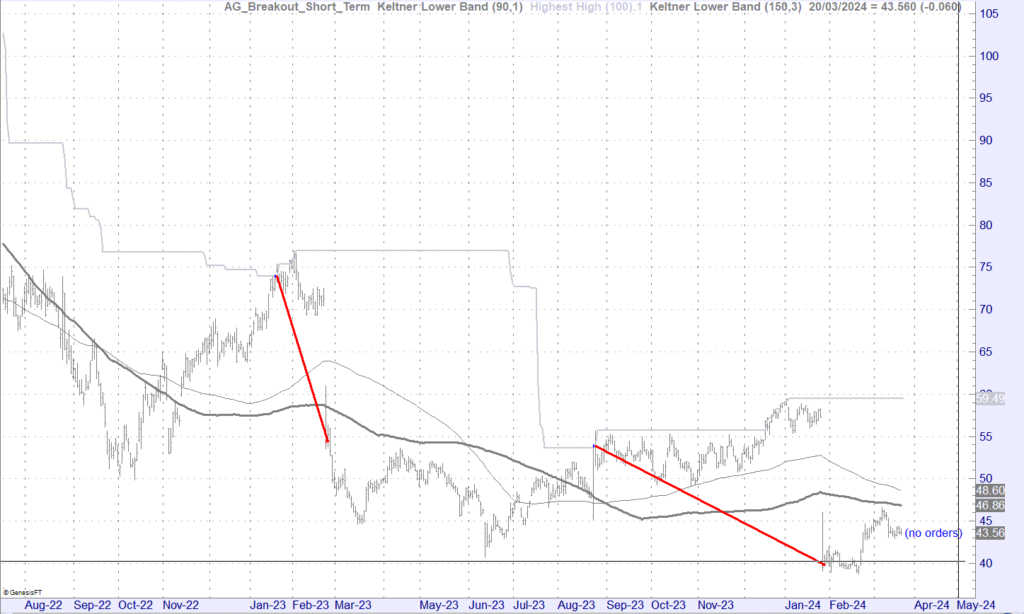
Trade Example#3 – Dominos Pizza (DMP)
- Entry on the 19th of January 2023 at $74.61
- Exit on the 23rd of February 2023 at $54.40
- Result: Loss of $20.21 or -27.09%
- Entry on the 24th of August 2023 at $54.15
- Exit on the 29th of January 2024 at $39.85
- Result: Loss of $14.30 or -26.41%
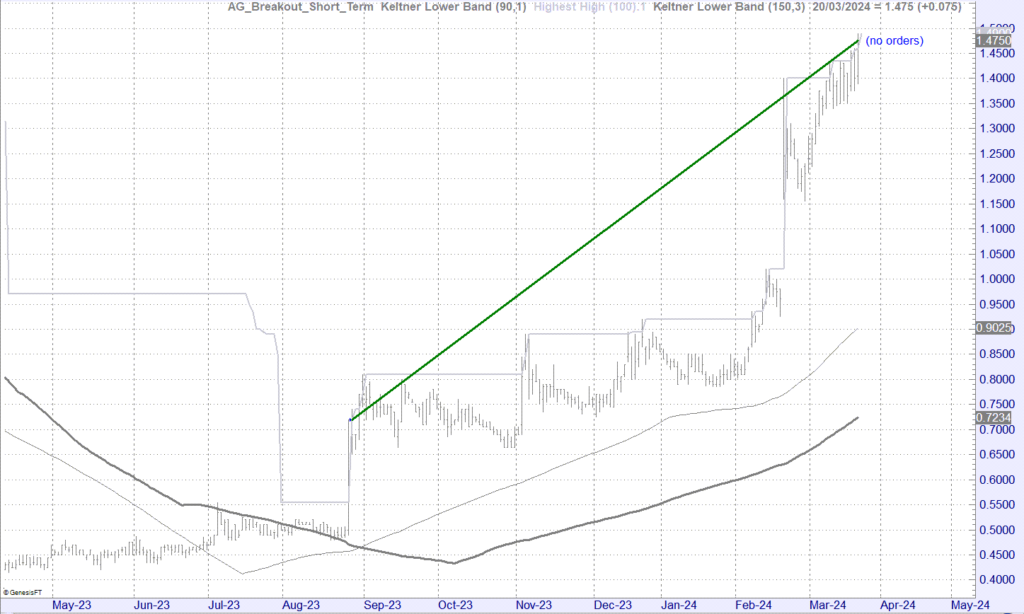
Trade Example#4 – Bravura Solutions (BVS)
- Entry on the 28th of August 2023 at $0.72
- Open Position as at the 21st March 2024 at $1.475
- Result: Open Position Profit of $0.755 or 104.86%
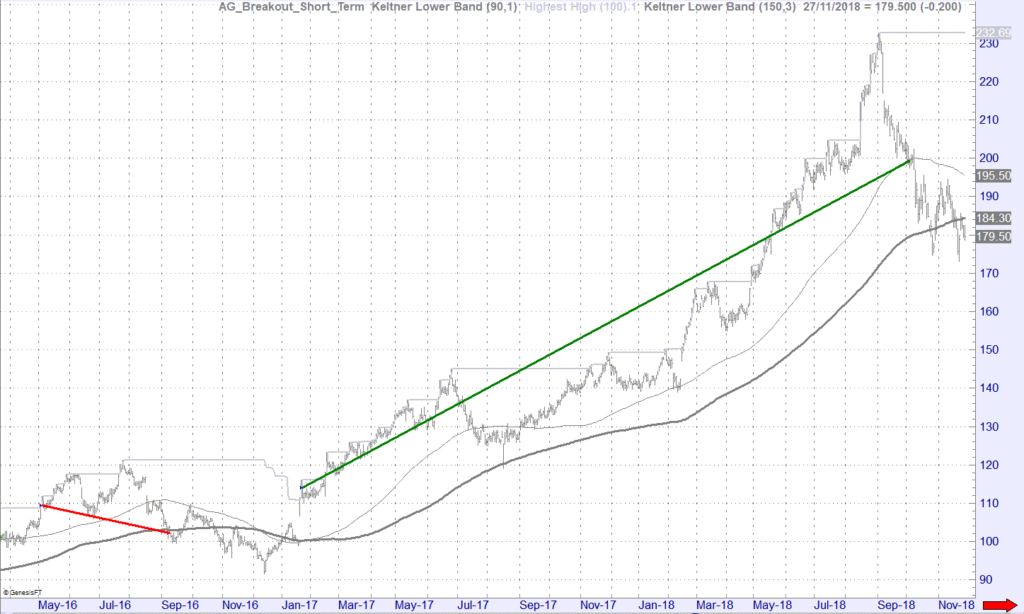
Trade Example#5 – CSL (CSL)
- Entry on the 4th May 2016 at $109.91
- Exit on the 8th of August 2016 at $102.21
- Result: Loss of $7.70 or -7.01%
- Entry on the 23rd January 2017 at $113.98
- Exit on the 2nd of October 2018 at $202.07
- Result: Profit of $88.09 or 77.29%
TO PROCEED CLICK "SIGN UP NOW"
The Breakout trading system is designed to navigate the ASX 200 with a disciplined approach, capitalising on profitable trends. It maintains a steady market presence and emphasises risk management. The system’s rules aim to optimise trade selection, focusing on a manageable number of positions to ensure individual account capacity. With key performance metrics guiding its strategy, Breakout is engineered for traders who prioritise a structured and methodical trading plan.
To have this strategy executed for you on your trading account please select the ‘Sign Up Now” button below to proceed. On the next page you will be asked for your name, email and phone number. We will check to see if you have an existing account, if so we will send you our Strategy Execution Agreement. If not we will help you to open an account with Interactive Brokers, which will be linked to MTA so we are able to execute trade on your account once funded.