PINNACLE 500 CFD
Leveraged returns, managed risks! Trade Pinnacle on the S&P500, an active trading system for opportunity driven traders.
SHARE THIS PAGE
- What is Share Trading01
- Key Features of Share Trading02
- Trade Both Long and Short03
- Calculating Profits and/or Losses04
- Share Trading Examples05
- Key Benefits of Shares06
- Margin Lending07
- Risks of Share Trading08
- Styles of Share Trading09
- Tools & Resources10
- How to Open an Account11
- Supported Brokers12
Pinnacle 500 CFD Trading System
Pinnacle 500 is a system totally executed and supervised by MyTradingAdvisor on your trading account.
Our mission is to help our clients gain exposure to the stock market, without having to do any of the heavy lifting themselves. Best part – there are no joining fees and you can have the opportunity to have a professionally built strategy executed on your account.
1. Introducing Pinnacle 500
The "Pinnacle 500 System" is a precise trading system tailored for trading stock CFDs on the S&P 500 Index.
The system engineered to detect and leverage oversold conditions, targeting short-term gains with a fully mechanical setup. With no discretionary inputs needed, our strategy execution agreement entails we handle all the trade executions on your behalf. This allows for minimal daily management from you, except for the important task of trade monitoring.
The strategy blends two distinct entry setups: one optimised for uptrending markets and another designed for downtrending conditions. Trade lengths vary, with the short-term component averaging about one month and the trend following component extending to several months or beyond, based on prevailing trends.
Entry and exit rules are at the strategy’s core, distinguishing between bullish and bearish market states while focusing on heavily oversold conditions for entry points. Technical analysis, specifically the Relative Strength Index (RSI) and Average True Range (ATR), forms the backbone of the strategy, providing key insights for potential trade execution and closure, using RSI to spot oversold situations and ATR multiples to set profit and stop-out levels.
The Pinnacle 500 System is designed for traders seeking a systematic, data-oriented approach to position trading within the S&P 500, aiming for timeframes ranging from weeks to several months. A critical element of the strategy is proactive downside risk management, with a robust exit strategy to cut losses early.
| Pinnacle 500 | Details |
|---|---|
| Minimum Investment | US$12,500 |
| Market | S&P500 Stocks |
| Average Trade | 3.78% |
| Average Trade Length | 8.8 Weeks |
| Percentage Winning Trades | 49.5% |
| Win:Loss Ratio | 2.59 |
- The minimum account size is based upon a five stock CFD portfolio with US$7,500 face value investment per stock for a total face value of US$37,500, which results in leverage of 3 times the suggested minimum investment amount.
2. Why the S&P 500 Stocks?
The S&P 500 Index is a top-tier stock market index representing 500 of the leading companies in the U.S. across various sectors, reflecting the overall market health. Its broad industry coverage includes high-growth sectors and established areas, providing a diversified investment canvas. The constituents are periodically reviewed, allowing the index to stay current with the evolving market landscape.
KEY POINTS:
1
Diversified Exposure to the United States Economy
The S&P 500 encompasses a variety of sectors, from technology and healthcare to consumer goods and financial services. This variety ensures investors can benefit from growth across the broader economy, mitigating sector-specific downturns and capturing the strength of market leaders.
2
VOLATILITY
The S&P 500 is emblematic of the market’s heartbeat, displaying periods of heightened volatility that present informed traders with the chance to capitalize on price fluctuations. These fluctuations can be driven by economic data releases, earnings reports, geopolitical events, and shifts in monetary policy, all of which can cause rapid price changes. For traders utilizing the Pinnacle 500 strategy, such volatility is not just noise but opportunity. By applying technical analysis and systematic trading rules, the strategy aims to exploit these movements to enter and exit positions at advantageous points, potentially leading to significant gains.
3
LIQUIDITY
Liquidity is the lifeblood of active trading, and the S&P 500 benefits from being one of the most liquid markets in the world. High liquidity means that large orders can be filled at competitive prices without significantly affecting the market price. For the Pinnacle 500 system, this high level of liquidity minimiSes the cost of transactions and ensures that strategy execution can occur swiftly and efficiently. It also provides the flexibility to adjust positions quickly in response to changing market conditions or risk exposure, a critical advantage in both fast-moving markets and more subdued trading environments.
4
frontline companies
The index is home to companies that are at the vanguard of their respective fields, often driving innovation and setting industry standards. This gives traders access to stocks with high growth potential and the chance to be part of transformative industry trends.
5
RISK DIVERSIFICATION
Investing in the S&P 500 naturally involves spreading capital across multiple industries, allowing for a well-balanced portfolio. While the focus can be on growth stocks, the inclusion of stable, blue-chip companies helps in cushioning against market volatility, offering a composite blend of growth and stability.
6
ADAPTABILITY TO MARKET TRENDS
The S&P 500’s dynamic composition is regularly updated to reflect market changes, ensuring that it remains representative of today’s economic landscape. For investors, this means participating in an index that is adaptive and responsive to both the current climate and future shifts, offering a robust platform for both seasoned and new traders.
3. Strategic Considerations
In the Pinnacle 500 technical trading system, a cornerstone of the strategy is the nuanced application of technical analysis to distinguish between winning and losing trades effectively. This approach ensures that winning trades, indicative of stocks or sectors demonstrating robust performance, are held for an extended duration to maximize gains. Conversely, losing trades are swiftly cut to minimize losses, emphasizing the system's prioritization of capital preservation and risk management. This methodological distinction means that the system inherently favors positions in stocks showing the best performance, allowing them to compound gains over time.
The strategic implementation of technical indicators, such as the Relative Strength Index (RSI) and Average True Range (ATR), plays a pivotal role in identifying these winning trades. By applying these indicators within the framework of the Pinnacle 500, the system is adept at pinpointing moments when stocks are poised for sustained upward momentum or are likely to recover from temporary setbacks. This selective retention of high-performing stocks, paired with the disciplined elimination of underperformers, ensures that the portfolio remains optimized for growth and resilience against market fluctuations.

Ultimately, Pinnacle 500’s approach to holding winners while cutting losers is an integral component to its dynamic and responsive trading philosophy. This strategy not only capitalises on the growth potential of the S&P 500’s leading stocks but also reinforces the system’s commitment to risk-adjusted returns. By retaining stocks that offer the best performance for longer periods, the system seeks to leverage the full spectrum of market opportunities, underscoring its efficacy as a technical trading solution within the volatile landscape of equity markets.
4. What is the Pinnacle 500 Strategy:
The Pinnacle 500 strategy is a trading method designed to make decisions on when to buy (or "go long" on) stocks within the S&P500 market, focusing on short-term opportunities. It uses a combination of technical analysis tools to identify potential entry points for buying stocks with the hope of selling them later at a higher price for profit. Let's break down the key components and rules of this strategy in simpler terms:
DATA INFO:
The strategy uses data from the S&P 500 market, analysing both daily and weekly price movements of stocks within this index.
5. The Rules
The strategy consists of several rules for deciding when to buy (enter) or sell (exit) stocks. These rules are based on technical indicators, primarily focusing on the Average True Range indicator (ATR) and the Relative Strength Indicator (RSI).
- Bull Market Entry: This rule identifies buying opportunities within an uptrend when the market is temporarily oversold. It relies on the four period RSI falling below a lower thresold, to signal when prices have fallen to a level that may be considered oversold, whilst the stock remains in a longer-term uptrend defined by the lower Keltner band offering a strategic entry point for traders to capitalise on the resumption of the uptrend.
- Bear Market Entry: This rule triggers a buy signal when the closing price has been heavily sold off. It leverages the concept of countertrend trading, where entering the market during a sell-off can at times result in an entry at the beginning of a new bullish trend. This strategy comes into play when the closing price is below the lower Keltner Band when both the four period weekly RSI and four period daily RSI is below a lower threshold.
- Stop Loss: The stop loss for this system initiates when the lowest low in the trades is more than 3% from entry. If this condition is triggered, we set a target price at the lowest point in the trade plus 1.5 times Average True Range. When the close finishes above this level we exit on the following days open.
- Profit Target: This rule sets a target price to sell and take profits, calculated as the lowest price during the trade plus a multiple of average true range (ATR).

6. How it Works in Practice
Remember, while strategies like Pinnacle 500 can provide great trade setups, they're not foolproof. Market conditions can at times be unfavorable, and risk management is crucial. Always be prepared for the possibility of loss.

IDENTIFY OPPORTUNITY
Use the rules to find stocks that have hit a low point according to the strategy’s criteria.

ENTER THE TRADE:
Buy the stock when it meets the entry conditions.

SET PROFIT TARGET
Know in advance what the profit target is, based on the strategy’s profit target rule.

EXIT STRATEGY:
Sell the stock when it reaches the profit target or if any conditions suggest it’s time to exit to minimise losses.

LEVERAGE IS OPTIONAL
CFD facilities allow leveraged trading on shares with the potential to obtain a high degree of leverage. CFDs enable you to outlay a portion of the overall purchase value (in the form of the Initial Deposit) to secure an exposure to the movements in the value of the Stock without having to pay the full price of actually acquiring the Stock. You can generally borrow as much as 50-90% of the value of the purchase for large-cap stocks.

OUTSOURCE YOUR TRADE EXECUTION
This strategy is fully mechanical which allows you to outsource the management of the strategy on your account to MyTradingAdvisor. MTA will monitor the system on a day to day basis and execute the orders for the system on your account according to the terms and condition in the Strategy Execution Document.
7. Risk Management
Risk management is a critical component of successful CFD trading, especially when implementing strategies like the Pinnacle 500. Given the leveraged nature of CFDs, where traders can control a large position with a relatively small amount of capital, understanding and managing risk becomes paramount. The Pinnacle 500 strategy integrates rigorous risk management protocols to safeguard traders from the volatile swings of the S&P 500, focusing on preserving capital while striving for growth. By setting predefined close-out orders and monitoring trade sizes, the strategy ensures that losses are kept within manageable limits, preventing any single trade from disproportionately affecting the overall portfolio.
Leverage, while a powerful tool in magnifying gains, equally amplifies losses, making it essential for traders using the Pinnacle 500 strategy to adopt a cautious approach to leverage utilisation. The strategy advocates for the use of leverage ratios that align with the trader’s risk tolerance and capital base, recommending conservative leverage to mitigate the impact of market reversals. Additionally, diversification plays a crucial role in the Pinnacle 500’s approach to risk management. By spreading investments across various sectors within the S&P 500, the strategy aims to reduce systemic risk and avoid overexposure to any single market movement, leveraging the diversification inherent in the index to buffer against volatility.
Moreover, continuous market analysis and the strategic use of technical indicators underpin the Pinnacle 500’s risk management framework. Indicators such as the RSI and ATR provide valuable insights into market conditions, helping to identify potential entry and exit points that align with the strategy’s risk parameters. This analytical approach enables the Pinnacle 500 to adapt to changing market dynamics, employing a flexible strategy that can tighten or loosen its risk parameters in response to market volatility. This adaptability ensures that the strategy remains robust across different market conditions, preserving capital during downturns while capitalising on growth opportunities.
We suggest traders should target a portfolio size of between 5 and 20 stocks with a minimum trade size being a face value of US$7,500 per stock.
8. Strategy Statistics
The purpose of showing the performance summary for the Pinnacle 500 trading system is to analyse the results across the S&P 500 stock constituents as at the 28th of February 2024. The most important metrics are winning percentage, average trade, and payout ratio. As the performance report provides an aggregate measure for the results of trading across all stocks and taking every trade, it is useful for getting a gauge as to average profitability per trade and how much can be risked on a per trade basis.
In practice it would not be possible to take every single trade across all stocks as most accounts would not be large enough to handle more than 10-20 open trades at any one time, and as such numbers need to be analysed in this context.
Closed Trade Equity Curve
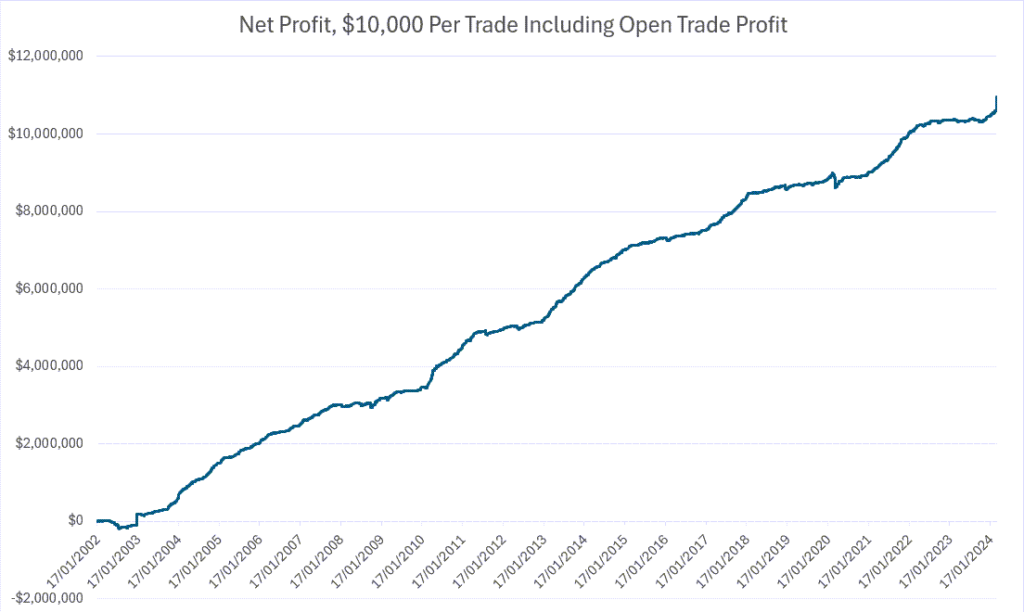
The closed trade equity curve show the results for the Pinnacle 500 system rules if traded with a fixed US$10,000 per trade from January 1, 2002, to February 19, 2024, on the stocks in the S&P 500 Index as at 28th February 2024.
The summary below is based upon aggregate results from every trade taken.
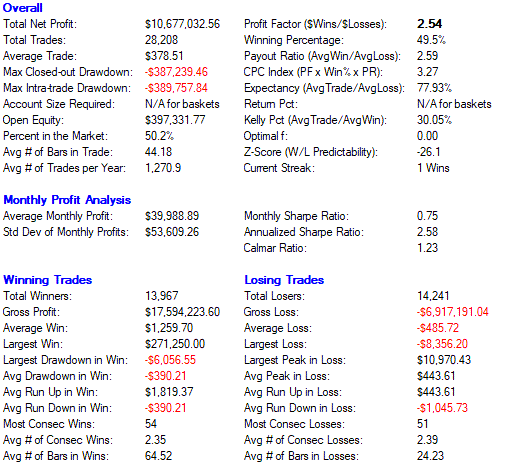
OVERALL PERFORMANCE
- Assumptions: Trade Size: $10,000 per trade. All figures in USD.
- Number of Trades: All trades taken across all 500 stocks.
- Date Frame: 1st January 2002-29th February 2024.
- Total Net Profit: The profit after all wins and losses, totalling $10,677,032.56.
- Total Trades: The total number of trades made which is 28,208.
- Average Trade: The average profit or loss per trade, $378.51.
- Max Closed-out Drawdown: The largest aggregate peak-to-trough decline in the account balance assuming all trades taken, -$387,239.
- Max Intra-trade Drawdown: The largest aggregate drop in the position’s value of all trades, -$389,757.
- Open Equity: The unrealized profit/loss of open positions, $397,331.
- Percent in the Market: The percentage of time in the market, 50.2%.
- Avg # of Bars in Trade: The average number of trading days a trade is held, 44.18.
- # of Trades per Year: The average number of trading signals per year, 1270.

MONTHLY PROFIT ANALYSIS
- Average Monthly Profit: The average profit made per month, $39,988 assuming all trades taken.
- Std Dev of Monthly Profits: The standard deviation of monthly profits, indicating volatility in monthly returns, $53,609 assuming all trades taken.

WINNING VS. LOSING TRADES
Winning Trades
- Winning Trades Total Winners: With 13,967 winners, the strategy has a strong track record of successful trades.
- Gross Profit: The winning trades have accumulated a gross profit of $17,594,223.60, reflecting the earning power of successful trades.
- Average Win: An average winning trade profit of $1,259.70 shows good return potential on successful trades.
- Largest Win: The biggest profit from a single trade is an impressive $271,250.00.
- Avg Run Up in Win: The average peak gain of winning trades before closing is $1,819.37, indicating potential trade profitability.
- Avg # of Bars in Winners: Winning trades are held for an average of 64.52 price bars, typically longer than losing trades.
Losing Trades
- Losing Trades Total Losers: The strategy has incurred 14,241 losing trades, indicating the frequency of losses.
- Gross Loss: The total loss from these trades amounts to -$6,917,191.04, accounting for the cost of unsuccessful trades.
- Average Loss: The average loss per losing trade is -$485.72, which is managed against the wins.
- Avg # of Bars in Losses: Losing trades are held for an average of 24.23 price bars, typically shorter than winning trades.

RISK METRICS
- Profit Factor: At 2.54, this ratio of gross profits to gross losses highlights the strategy’s profitability.
- Winning Percentage: Nearly half of the trades, 49.5%, are profitable, illustrating a solid success rate.
- Expectancy: Each trade yields an average expectancy of 2.52, showing the average amount won or lost per trade.
- CPC Index: The CPC Index score of 7.27 combines win rate and payout ratio, underscoring strategy efficiency.
- Kelly Pct: The Kelly criterion suggests an optimal bet size of 33.93%, offering guidance on capital allocation.

SUMMARY
This detailed summary provides insights into the Pinnacle 500 strategy’s risk management and profitability, demonstrating its comprehensive approach to trading on the S&P 500 through CFDs.
9. Examples
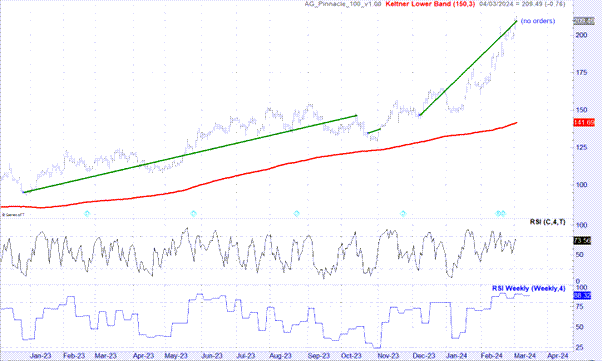
Trade Example#1 – Applied Materials (AMAT)
Trade #1
- Entry on the 27th of December 2022 at $95.14
- Exit on 13th of October 2023 at $146.49
- Result: Profit of $51.35 or 53.9%
Trade #2
- Entry on the 24th of October 2023 at $134.81
- Exit on the 2nd of November 2023 at $137.28
- Result: Profit of $2.47 or 1.83%
Trade #3
- Entry on the 7th of December 2024 at $146.71
- Current Position trading at $209.49 as at 4th March 2024
- Result: Open trade profit of $62.78 or 42.79%
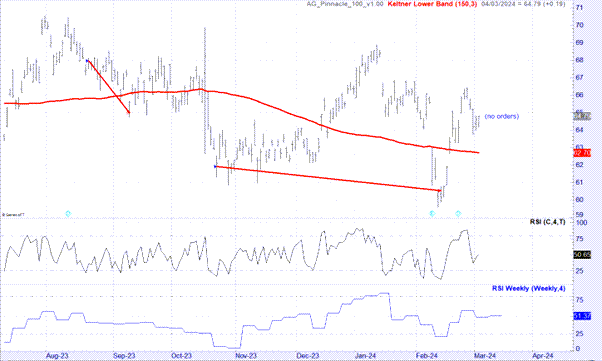
Trade Example#2 – Astra Zeneca (AZN)
Trade #1
- Entry on the 21st of August 2023 at $67.96
- Exit on the 11th of September 2023 at $64.98
- Result: Loss of $2.98 or 4.38%
Trade #2
- Entry on the 23rd October 2023 at $61.90
- Exit on the 13th February 2024 at $60.34
- Result: Loss of $1.56 or 2.52%
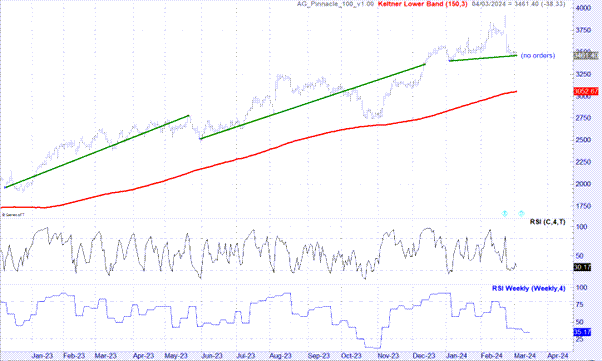
Trade Example#3 – Booking Holdings (BKNG)
Trade #1
- Entry on the 8th of December 2023 at $1962.39
- Exit on the 19th of May 2023 at $2780.97
- Result: Profit of $818.58 or 41.7%
Trade #2
- Entry on the 31st of May 2023 at $2516.77
- Exit on the 11th of December 2023 at $3287.65
- Result: Profit of $770.88 or 30.6%
Trade #3
- Entry on the 4th of January 2024 at $3400
- Current price as at 4th March 2024 $3461.79
- Open position profit of $61.79 or 1.8%
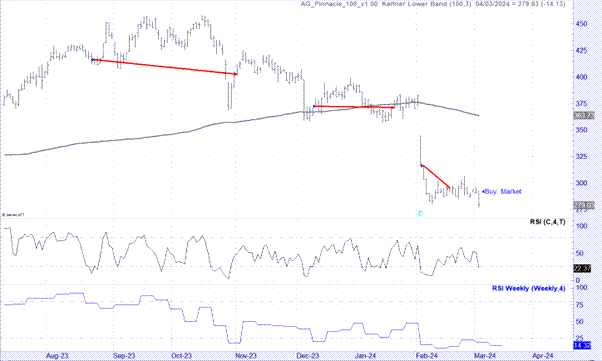
Trade Example#4 – Charter Communications (CHTR)
Trade #1
- Entry on the 23rd of August 2023 at $416.31
- Exit on the 1st of November 2023 at $402.85
- Result: Loss of $13.46 or -3.23%
Trade #2
- Entry on the11th of December 2023 at $372.59
- Exit on the 22nd of January 2023 at $371.10
- Result: Loss of $1.49 or -0.4%
Trade #3
- Entry on the 5th February 2024 at $316.11
- Exit on the 16th of February 2024 at $295.40
- Loss of $20.71 or -6.55%
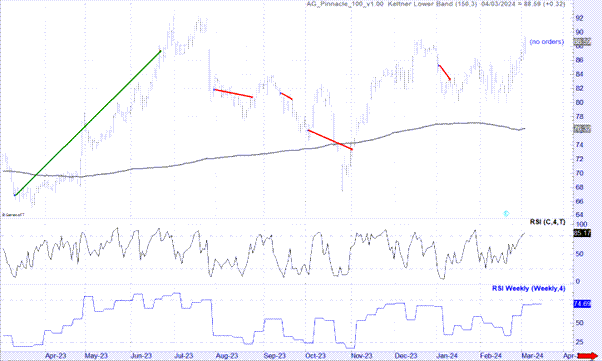
Trade Example#5 – CoStar Group (CSGP)
Trade #1
- Entry on the 13th of March 2023 at $66.85
- Exit on the 22nd of June 2023 at $87.35
- Result: Profit of $20.50 or 30.66%
Trade #2
- Entry on the 31st of July 2023 at $81.83
- Exit on the 24th of August 2023 at $80.78
- Result: Loss of $1.05 or 1.28%
Trade #3
- Entry on the 14th of September 2023 at $81.33
- Exit on the 21st of September 2023 at $80.50
- Result: Loss of -$0.83 or -1.02%
Trade #4
- Entry on the 3rd of October 2023 at $76.09
- Exit on the 1st of November 2023 at $73.38
- Result: Loss of $2.71 or -3.56%
Trade #5
- Entry on the 3rd of January 2024 at $85.25
- Exit on the 10th of January 2024 at $83.24
- Result: Loss of -$2.35 or -2.75%
TO PROCEED CLICK "SIGN UP NOW"
The Pinnacle 500 Strategy is a robust system, with the rules showing a strong historical positive expectancy. For traders seeking to amplify their investment portfolios this strategy is particularly enticing due to its strong performance metrics.
Investors interested in a disciplined and tested approach to trading, with clear historical evidence of success, should consider the Pinnacle 500 Strategy as a compelling option for their short-term trading endeavours. It’s an opportunity to participate in a robust strategy that has the potential to demonstrate resilience and profitability over time.
To have this strategy executed for you on your trading account please select the ‘Sign Up Now” button below to proceed. On the next page you will be asked for your name, email and phone number. We will check to see if you have an existing account, if so we will send you our Strategy Execution Agreement. If not we will help you to open an account with Interactive Brokers, which will be linked to MTA so we are able to execute trade on your account once funded.