PRIUS
Catch the BIG move! Trade Prius, a mechanical system that is designed to capture big moves in bull markets!
CAPTURE THE BIG MOVE!
- What is Share Trading01
- Key Features of Share Trading02
- Trade Both Long and Short03
- Calculating Profits and/or Losses04
- Share Trading Examples05
- Key Benefits of Shares06
- Margin Lending07
- Risks of Share Trading08
- Styles of Share Trading09
- Tools & Resources10
- How to Open an Account11
- Supported Brokers12
Prius Trading System
Prius is a system totally executed and supervised by MyTradingAdvisor on your trading account.
Our mission is to help our clients gain exposure to the stock market, without having to do any of the heavy lifting themselves. Best part – there are no joining fees and you can have the opportunity to have a professionally built strategy executed on your account.
1. Introducing Prius
Prius allow for the capture of large bullish moves when markets are trending higher, but quickly adapts to volatile market conditions by implementing shorter term strategies when markets are bearish.
The “Prius System” is a detailed trading methodology designed for position trading with a mix of trading styles from short term to medium term combined into a single system, hence the name. The average trade for the short-term component of the strategy has traders in a trade for approximately one month, however the trend following component of the strategy can hold trades for potentially 1-2 years when trend conditions prevail. It leverages specific market conditions such as price movements and volatility to guide trading decisions. This system employs a set of rules for entering and exiting trades, notably entry conditions which include buying into breakouts, entering during pull backs in an uptrend, and buying into heavily oversold markets.
The strategy is heavily reliant on technical analysis, utilising indicators like the Relative Strength Index (RSI) and Average True Range (ATR) to inform decisions. These indicators help identify potential entry and exit points based on market momentum and volatility, aiming to optimise the timing of trades for profitability.
In essence, the Prius System is designed for traders looking for a structured, data-driven approach to navigating short-term and medium-term market movements. By adhering to the specified rules and utilising technical indicators for guidance, the system aims to make informed decisions that capitalise on market trends while minimising risks.
| Prius | Details |
|---|---|
| Minimum Investment | US$37,500 |
| Market | Nasdaq 100 |
| Average Trade | 11.17% |
| Average Trade Length | 21.8 Weeks |
| Percentage Winning Trades | 53.1% |
| Win:Loss Ratio | 2.63 |
2. Why the Nasdaq 100 Stocks?
The Nasdaq 100 Index is a premier stock market index that represents the performance of 100 of the largest non-financial companies listed on the Nasdaq stock exchange. Known for its heavy emphasis on technology and innovation, the index includes a diverse range of companies from various sectors such as technology, retail, biotechnology, and healthcare. This makes the Nasdaq 100 not only a key barometer of the tech sector's health but also a reflection of broader innovation trends across the US economy. Constituents like Apple, Microsoft, Amazon, Alphabet, and Meta Platforms underscore the index's tech dominance, although its reach extends into other dynamic sectors, offering a comprehensive snapshot of contemporary corporate success and innovation.
KEY POINTS:
1
Broad Exposure to Innovation:
The Nasdaq 100 provides exposure to forefront companies driving technological advancement and market trends. Traders and investors gain access to a concentrated portfolio of high-growth potential stocks, encapsulating the pulse of innovation across various sectors.
2
VOLATILITY AND LIQUIDITY
Constituents of the Nasdaq 100 typically exhibit high volatility and liquidity, creating ample trading opportunities. The presence of major tech companies ensures active trading, enabling efficient entry and exit strategies for traders looking to capitalize on short-term movements or longer-term trends.
3
GROWTH POTENTIAL
The tech-heavy composition of the index often translates to higher growth prospects. Companies within the Nasdaq 100 are generally at the leading edge of technological advancements and market shifts, offering traders the potential for significant returns as these companies expand and evolve.
4
DIVERSIFICATION WITHIN HIGH GROWTH SECTORS
While the Nasdaq 100 is renowned for its focus on technology, the inclusion of companies from other innovative sectors allows for diversification. Traders can spread risk across different industries while maintaining a focus on growth-oriented stocks.
5
TRADING SHARES
Trading shares, compared with investing, is a more hands-on activity with daily or weekly monitoring of your account, which involves buying and selling with the aim to capitalize on shorter-term fluctuations. The purpose of trading is to generate income to supplement a primary source of income with the possible secondary goal of perhaps one-day trading for a living.
6
ADAPTABILITY TO MARKET TRENDS
The index is periodically reviewed and adjusted, ensuring it remains reflective of the leading non-financial companies on the Nasdaq. This adaptability means that the Nasdaq 100 evolves with the market, incorporating emerging leaders and shedding companies that fall behind, providing traders with a vehicle that aligns with current and emerging market trends.
3. Strategic Considerations
Engaging with the Nasdaq 100, through direct stock trades, requires an understanding of the index's characteristics and the sectors it encompasses. The dominance of tech stocks means that shifts in technology trends or regulatory landscapes can significantly impact the index. Additionally, the high growth nature of these companies often comes with increased volatility and sensitivity to market dynamics, such as interest rate changes or economic shifts.
For traders, the Nasdaq 100 offers a blend of opportunity and challenge. The potential for substantial returns is counterbalanced by the need for vigilant risk management and an informed approach to market changes. Diversifying within the index’s constituents, staying abreast of technological and sector trends, and employing strategies that account for the inherent volatility can enhance the prospects for success.

Trading Tip: The Nasdaq 100 Index and its constituents represent a vibrant cross-section of modern industry leaders and innovators. For those looking to engage with the cutting edge of the market, trading within this index offers a pathway to tap into the growth, volatility, and transformative potential of some of the world’s most influential companies. With careful strategy and risk management, traders and investors can navigate the complexities of the Nasdaq 100 to potentially secure substantial gains.
4. What is the Prius Strategy:
The Prius strategy is a trading method designed to help traders make decisions on when to buy (or "go long" on) stocks within the Nasdaq 100 market, focusing on short-term and medium-term opportunities. It uses a combination of technical analysis tools to identify potential entry points for buying stocks with the hope of selling them later at a higher price for profit. Let's break down the key components and rules of this strategy in simpler terms.
DATA INFO:
The strategy uses data from the Nasdaq 100 market, analysing both daily and weekly price movements of stocks within this index.
5. The Rules
The strategy consists of several rules for deciding when to buy (enter) or sell (exit) stocks. These rules are based on technical indicators, primarily focusing on the Average True Range indicator (ATR) and the Relative Strength Indicator (RSI).
- Oversold Entry in Uptrend: This rule identifies buying opportunities within an uptrend when the market is temporarily oversold. It relies on the RSI to signal when prices have fallen to a level that may be considered oversold, whilst the stock remains in a longer-term uptrend offering a strategic entry point for traders to capitalise on the resumption of the uptrend.
- Breakout Entry: This rule triggers a buy signal when the closing price surpasses the highest price of the last 75 days, provided that more than 25 days have elapsed since the last exit. It leverages the concept of breakout trading, where entering the market after a price breakout above a historical resistance level can indicate the continuation of a new bullish trend.
- Pullback Entry: This trade looks to enter new trades after a significant sell-off:
- Its price is significantly lower than the highest high of the last 15 days as measured by a factor of average true range.
- Its RSI is below its lower threshold, suggesting it may be a good time to enter at a potentially low price.
- RSI Entry: This rule utilises the Relative Strength Index (RSI), a momentum oscillator that measures the speed and change of price movements. A buy signal is generated if the RSI crosses below a specified threshold on a daily chart, if the weekly RSI is also oversold. We utilise RSI thresholds between 15 and 25. A heavily oversold market often precedes a reversal and an upward price movement.
- Profit Target: This rule sets a target price to sell and take profits, calculated as the lowest price during the trade plus a multiple of the ATR.
- Stop Loss: Prius looks to exit trades if the stock moves down by more than 15% from the entry price.
- Uptrend Exit: If the market is trending higher Prius will set a much larger profit target with a the view of capturing a big move.
6. How it Works in Practice
Remember, while strategies like Prius can provide great trade setups, they're not foolproof. Market conditions can at times be unfavorable, and risk management is crucial. Always be prepared for the possibility of loss.

IDENTIFY OPPORTUNITY
Use the rules to find stocks that have hit a low point according to the strategy’s criteria.

ENTER THE TRADE:
Buy the stock when it meets the entry conditions.

SET PROFIT TARGET
Know in advance what the profit target is, based on the strategy’s profit target rule.

EXIT STRATEGY:
Sell the stock when it reaches the profit target or if any conditions suggest it’s time to exit to minimise losses.

LEVERAGE IS OPTIONAL

OUTSOURCE YOUR TRADE EXECUTION
This strategy is fully mechanical which allows you to outsource the management of the strategy on your account to MyTradingAdvisor. MTA will monitor the system on a day to day basis and execute the orders for the system on your account according to the terms and condition in the Strategy Execution Document.
7. Risk Management
When using the Prius strategy risk management should involve diversifying across a portfolio of 5-15 stocks. Diversification spreads the risk and reduces the volatility that can come from relying on the performance of a single or small group of stocks. The key is to select stocks that qualify under the Prius criteria from the Nasdaq 100 Index, which provides a wide array of high-growth potential companies.
By trading a carefully chosen set of 5-15 stocks, traders can manage their exposure to market fluctuations more effectively. This quantity is manageable for individual traders to monitor closely, ensuring they can react swiftly to the strategies indicators and market changes. The diversification within this range allows for the purchase of different companies, where the negative performance of one or a few stocks can be offset by gains in others.
Furthermore, this approach aligns with the principles of the Prius strategy, which capitalises on short-term and medium term market movements with trades lasting on average six months or more during bull market conditions. By having a diversified yet focused portfolio, traders can apply this strategy across multiple stocks, increasing their chances of capturing profitable trades without putting their entire investment at risk in one or two positions.
Overall, maintaining a portfolio of 5-15 stocks while using the Prius strategy is a practical approach to risk management. It enables traders to stay agile, making the most of the short-term trading opportunities that the Nasdaq 100 Index offers, while spreading their risk across multiple, carefully selected investments.
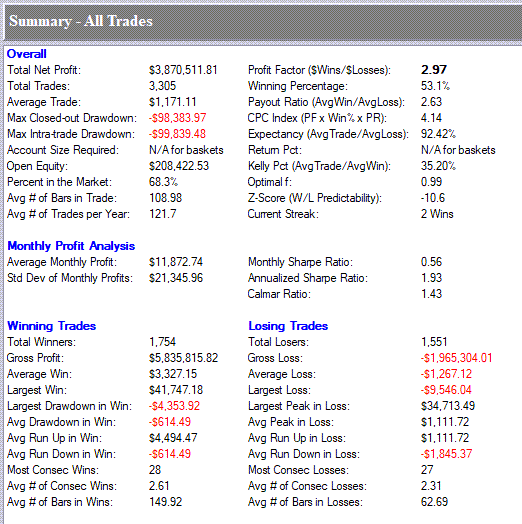
8. Strategy Statistics
The purpose of showing the performance summary for the Prius trading system is to analyse the results for trading the system across a wide variety of stocks. The performance summary analyses the current constituents of the Nasdaq 100 index. The most important metrics are winning percentage, average trade, and payout ratio. As the performance report provides an aggregate measure for the results of trading across all stocks and taking every trade, it is useful for getting a gauge as to average profitability per trade. In practice it would not be possible to take every single trade across all stocks as most accounts would not be large enough to handle more than 10-20 open trades at any one time, and as such numbers need to be analysed in this context.
Closed Trade Equity Curve
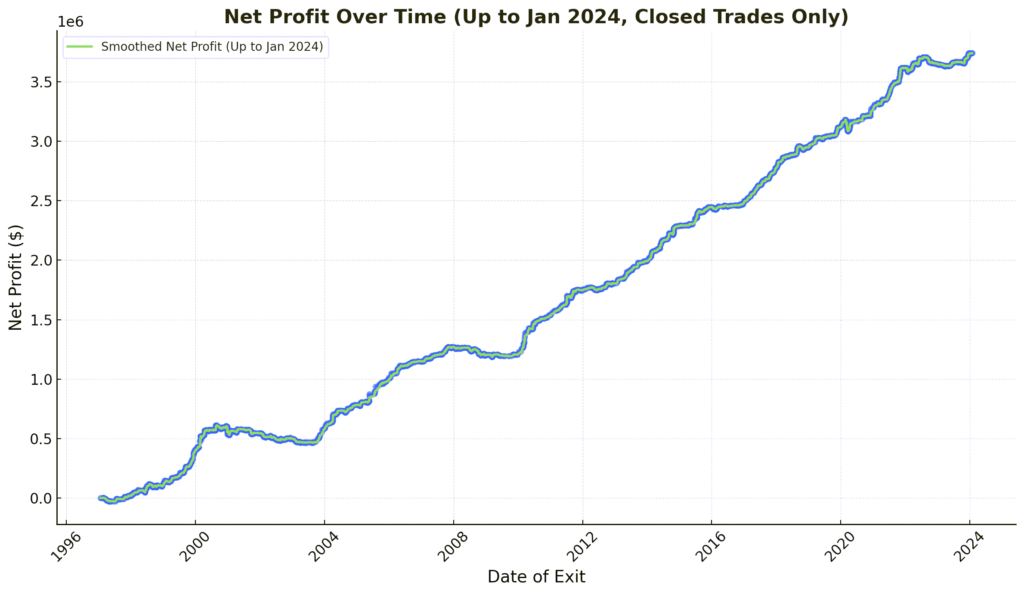
The closed trade equity curve show the results for the Prius system rules if traded with a fixed US$10,000 per trade from January 1, 1997, to February 19, 2024, on the stocks in the Nasdaq 100 Index as at 27th February 2024.
OVERALL PERFORMANCE
- Total Net Profit: The total profit after subtracting losses from the gross profit, which is $3,870,511.81. This is based on taking every trade with a US$10,000 per trade position from the 1st January 1997 to the 27th February 2024 on the current constituents of the Nasdaq 100 Index.
- Total Trades: The total number of trades taken, which is 3,305.
- Average Trade: The average profit per trade, $1,171.11 (11.71%)
- Max Closed-out Drawdown: The maximum peak-to-trough decline in the account’s balance, -$98,383.97. This is based on taking all 3035 trades across with a US$10,000 per trade position from the 1st January 1997 to the 27th February 2024 on the current constituents of the Nasdaq 100 Index.
- Max Intra-trade Drawdown: The largest drop in value during a trade before it was closed, -$99,839.48. This is based on taking all 3035 trades across with a US$10,000 per trade position from the 1st January 1997 to the 27th February 2024 on the current constituents of the Nasdaq 100 Index.
- Account Size Required: Not applicable for baskets, suggesting a strategy that doesn’t apply to a basket of instruments or the metric isn’t calculated.
- Open Equity: The current profit or loss on open positions, which is $208,422.53.
- Percent in the Market: The percentage of time the trading system is active in the market, 68.3%.
- Avg # of Bars in Trade: The average number of price bars that each trade was held, 108.98.
- Avg # of Trades per Year: The average number of trades executed per year, 121.7.

MONTHLY PROFIT ANALYSIS
- Average Monthly Profit: The average profit earned per month, $11,872.74 for taking all trades.
- Std Dev of Monthly Profits: The standard deviation of monthly profits, which measures the variability of monthly profits, $21,345.96.

WINNING VS. LOSING TRADES
Winning Trades
- Total Winners: The number of winning trades, 1,754.
- Gross Profit: The total profit from winning trades before expenses, $5,835,815.82.
- Avg Winner: The average profit of winning trades, $3,327.18 (33.27%).
- Avg Run Up in Win: The average unrealised profit peak of winning trades, $4,514.49 (45.14%).
- Avg Run Down in Win: The average unrealised profit trough of winning trades, -$614.49 (6.14%).
- Most Consec Wins: The longest streak of consecutive winning trades, 28.
- Avg # of Consec Wins: The average number of consecutive winning trades, 2.61.
- Avg # of Bars in Wins: The average number of price bars over which winning trades occurred, 149.92.
Losing Trades
- Total Losers: The number of losing trades, 1,551.
- Gross Loss: The total losses from losing trades, -$1,965,304.01.
- Average Loss: The average loss of losing trades, -$1,267.12 (12.67%).
- Avg Run Up in Loss: The average unrealised profit peak in losing trades, $946.04 (9.46%).
- Avg Run Down in Loss: The average unrealized loss trough in losing trades, -$1,845.37 (18.45%).
- Most Consec Losses: The longest streak of consecutive losing trades, 27.
- Avg # of Consec Losses: The average number of consecutive losing trades, 2.31.
- Avg # of Bars in Losses: The average number of price bars over which losing trades occurred, 62.69.

RISK METRICS
- Profit Factor: The ratio of gross profits to gross losses, 2.97.
- Winning Percentage: The percentage of trades that are winners, 53.1%.
- Payout Ratio: The average win to average loss ratio, 2.63.
- CPC Index: A profitability metric that combines win rate and payout ratio, 4.14.
- Expectancy: The average amount you can expect to win or lose per trade, $2.42/trade.
- Return Pct: The return percentage, which isn’t applicable for baskets.
- Kelly Pct: The Kelly criterion percentage, which suggests the optimal amount of capital to be used per trade, 35.2%. In practise this number should be around 5-10%.
- Optimal f: The optimal fixed fraction of capital to wager on each trade, 0.99.
- Z-Score: A statistic that measures the dependence of trade outcomes, indicating that winning and losing trades are not randomly distributed, -10.6.
- Current Streak: The current consecutive win or loss streak, which is 2 wins.
Performance Ratios
- Monthly Sharpe Ratio: A measure of risk-adjusted return, 0.56.
- Annualized Sharpe Ratio: The Sharpe ratio calculated on an annual basis, 1.93.
- Calmar Ratio: The ratio of the annualised compound rate of return to the maximum drawdown, 1.43.

SUMMARY
An analysis of the equity curve for this strategy shows the rules performed strongly in bull markets but did not lose heavily in bear markets. The periods from 2000-2003, 2007-2009 and 2021 to 2022 are periods where markets were in bear market territory.
9. Examples
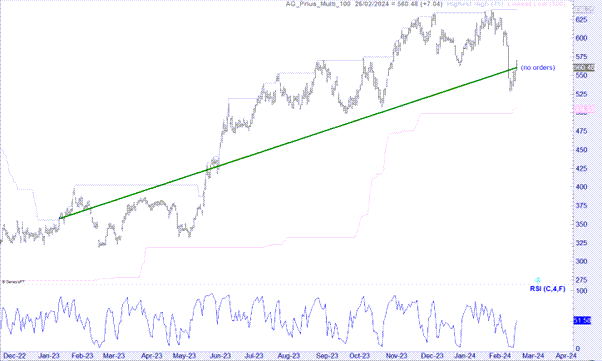
Trade Example#1 – Adobe (ADBE)
- Entry on the 20th of January 2023 at $358.28
- Closing Price of $560.48
- Result: Open Trade Profit of $202.20 or 56%
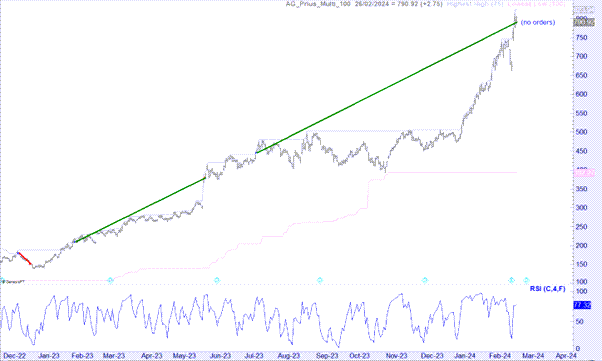
Trade Example#2 – Nvidia (NVDA)
- Entry on the 12th of August 2023 at $445.10
- Closing Price of $790.92
- Result: Open Position Profit of $345.82 or 78%
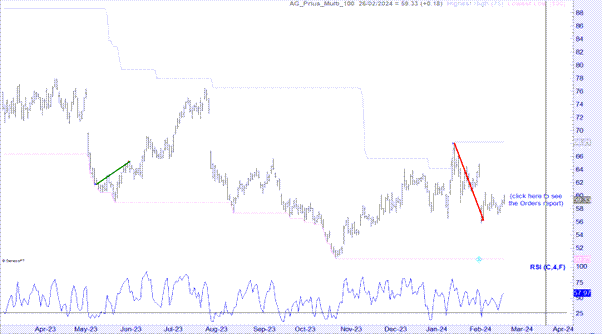
Trade Example#3 – Payapl (PYPL)
- Entry on the 22nd of January 2024 at $68.02
- Exit on the 9th of February 2024 at $56.21
- Result: Loss of $11.81 or -17.36%
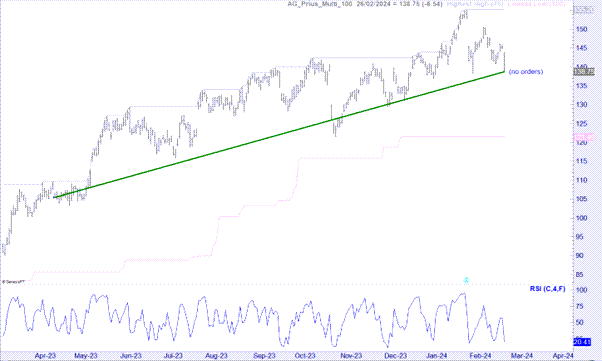
Trade Example#4 – Google (GOOG)
- Entry on the 17th of April 2023 at $105.43
- Current Price as at 27th February 2024 of $138.75
- Result: Open Position Profit of $33.32 or 31.6%
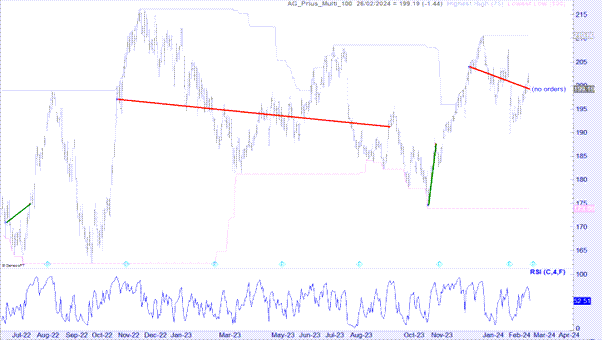
Trade Example#5 – Honeywell (HON)
- Entry on the 14th of December 2023 at $204
- Current Price as at 27th February 2024 is $199.19
- Result: Open Position Loss of $4.81 or -2.35%
Trade Example#6 – Keurig Dr Pepper (KDP)
- Entry on the 3rd of October 2023 at $30.87
- Exit on the 1st of November 2023 at $30.22
- Result: Loss of $0.65 or -2.10%

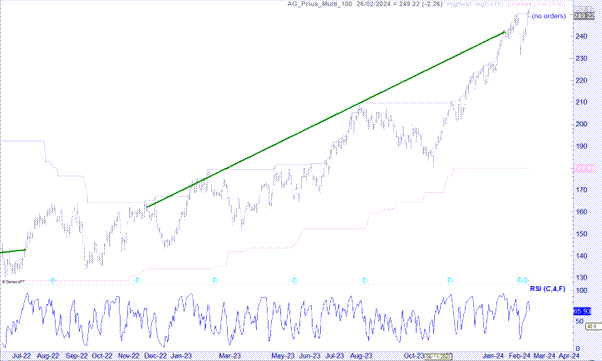
Trade Example#7 – Marriot Internation (MAR)
- Entry on the 5th of December 2022 at $162.25
- Exit on the 25th of January 2024 at $242.00
- Result: Profit of $79.75 or 49.15%
TO PROCEED CLICK "SIGN UP NOW"
The Prius Strategy rules have tested to be robust and profitable, with an impressive backtested performance report. For traders seeking to amplify their investment portfolios this strategy is particularly enticing due to its strong performance metrics.
Investors interested in a disciplined and tested approach to trading, with clear historical evidence of success, should consider the Prius Strategy as a compelling option for their medium-term trading endeavours. It’s an opportunity to participate in a robust strategy that has the potential to demonstrate resilience and profitability over time.
To have this strategy executed for you on your trading account please select the ‘Sign Up Now” button below to proceed. On the next page you will be asked for your name, email and phone number. We will check to see if you have an existing account, if so we will send you our Strategy Execution Agreement. If not we will help you to open an account with Interactive Brokers, which will be linked to MTA (MyTradingAdvisor) so we are able to execute trades on your account once funded.