RSI-4
Stock can rally out of the blocks quickly! Trade RSI-4, a mechanical system that positions in advance to potentially catch that fast moving rally!
CATCH THE BOUNCE!
- What is Share Trading01
- Key Features of Share Trading02
- Trade Both Long and Short03
- Calculating Profits and/or Losses04
- Share Trading Examples05
- Key Benefits of Shares06
- Margin Lending07
- Risks of Share Trading08
- Styles of Share Trading09
- Tools & Resources10
- How to Open an Account11
- Supported Brokers12
RSI-4 Trading System
RSI-4 is a system totally executed and supervised by MTA on your trading account.
Our mission is to help our clients gain exposure to the stock market, without having to do any of the heavy lifting themselves. Best part – there are no joining fees and you can have the opportunity to have a professionally built strategy executed on your account.
1. Introducing RSI-4
RSI-4 is designed to catch that first, fast moving rally following a sell-off.
The RSI-4 Strategy is a short-term mechanical trading system, that MyTradingAdvisor can execute for you on your trading account.
The system focuses on using the Relative Strength Index (RSI) over a four-day period to identify potential entry and exit points in the stock market. This strategy aims to take advantage of short-term price movements by identifying when stocks are potentially oversold for an entry, suggesting a possible reversal or correction in price is imminent and, once in the trade utilises an overbought level to take profit.
By applying this strategy to stocks within the Nasdaq 100 Index, which is heavily weighted towards technology and innovation-driven companies, traders can potentially benefit from the volatility of a resulting rally, following a sell off. The RSI-4 Strategy provides a structured approach to capitalise on quick market movements, offering traders the chance to make short-term trades based on these conditions.
Overall, the RSI-4 Strategy represents a focused approach to trading, targeting opportunities within the short-term fluctuations of the stock market. If you’re interested in learning more about the “RSI-4 Strategy” keep reading below.
| RSI-4 | Details |
|---|---|
| Minimum Investment | US$37,500 |
| Market | Nasdaq 100 |
| Average Trade | 3.64% |
| Average Trade Length | 3.54 Weeks |
| Percentage Winning Trades | 76.7% |
| Win:Loss Ratio | 1.01 |
2. Why the Nasdaq 100 Stocks?
The Nasdaq 100 Index is a premier stock market index that represents the performance of 100 of the largest non-financial companies listed on the Nasdaq stock exchange. Known for its heavy emphasis on technology and innovation, the index includes a diverse range of companies from various sectors such as technology, retail, biotechnology, and healthcare. This makes the Nasdaq 100 not only a key barometer of the tech sector's health but also a reflection of broader innovation trends across the US economy. Constituents like Apple, Microsoft, Amazon, Alphabet, and Meta Platforms underscore the index's tech dominance, although its reach extends into other dynamic sectors, offering a comprehensive snapshot of contemporary corporate success and innovation.
KEY POINTS:
1
Broad Exposure to Innovation:
The Nasdaq 100 provides exposure to forefront companies driving technological advancement and market trends. Traders and investors gain access to a concentrated portfolio of high-growth potential stocks, encapsulating the pulse of innovation across various sectors.
2
VOLATILITY AND LIQUIDITY
Constituents of the Nasdaq 100 typically exhibit high volatility and liquidity, creating ample trading opportunities. The presence of major tech companies ensures active trading, enabling efficient entry and exit strategies for traders looking to capitalize on short-term movements or longer-term trends.
3
GROWTH POTENTIAL
The tech-heavy composition of the index often translates to higher growth prospects. Companies within the Nasdaq 100 are generally at the leading edge of technological advancements and market shifts, offering traders the potential for significant returns as these companies expand and evolve.
4
DIVERSIFICATION WITHIN HIGH GROWTH SECTORS
While the Nasdaq 100 is renowned for its focus on technology, the inclusion of companies from other innovative sectors allows for diversification. Traders can spread risk across different industries while maintaining a focus on growth-oriented stocks.
5
TRADING SHARES
Trading shares, compared with investing, is a more hands-on activity with daily or weekly monitoring of your account, which involves buying and selling with the aim to capitalize on shorter-term fluctuations. The purpose of trading is to generate income to supplement a primary source of income with the possible secondary goal of perhaps one-day trading for a living.
6
ADAPTABILITY TO MARKET TRENDS
The index is periodically reviewed and adjusted, ensuring it remains reflective of the leading non-financial companies on the Nasdaq. This adaptability means that the Nasdaq 100 evolves with the market, incorporating emerging leaders and shedding companies that fall behind, providing traders with a vehicle that aligns with current and emerging market trends.
3. Strategic Considerations
Engaging with the Nasdaq 100, through direct stock trades, requires an understanding of the index's characteristics and the sectors it encompasses. The dominance of tech stocks means that shifts in technology trends or regulatory landscapes can significantly impact the index. Additionally, the high growth nature of these companies often comes with increased volatility and sensitivity to market dynamics, such as interest rate changes or economic shifts.
For traders, the Nasdaq 100 offers a blend of opportunity and challenge. The potential for substantial returns is counterbalanced by the need for vigilant risk management and an informed approach to market changes. Diversifying within the index’s constituents, staying abreast of technological and sector trends, and employing strategies that account for the inherent volatility can enhance the prospects for success.

Trading Tip: The Nasdaq 100 Index and its constituents represent a vibrant cross-section of modern industry leaders and innovators. For those looking to engage with the cutting edge of the market, trading within this index offers a pathway to tap into the growth, volatility, and transformative potential of some of the world’s most influential companies. With careful strategy and risk management, traders and investors can navigate the complexities of the Nasdaq 100 to potentially secure substantial gains.
4. What is the RSI-4 Strategy:
The RSI-4 strategy is a trading method designed to make decisions on when to buy (or "go long" on) stocks within the Nasdaq 100 market, focusing on short-term opportunities. It uses a combination of technical analysis tools to identify potential entry points for buying stocks with the hope of selling them later at a higher price for profit. Let's break down the key components and rules of this strategy in simpler terms:
DATA INFO:
The strategy uses data from the Nasdaq 100 market, analysing both daily and weekly price movements of stocks within this index.
5. The Rules
The strategy consists of several rules for deciding when to buy (enter) or sell (exit) stocks. These rules are based on technical indicators, primarily focusing on the Average True Range indicator (ATR) and the Relative Strength Indicator (RSI).
- RSI Entry 1: This rule is complex, suggesting buying based on the four period RSI of a price oscillator (a tool used to detrend price action) when it is below its lower threshold on both a daily and weekly basis.
- RSI Entry 2: This rule suggests buying a stock when:
- Its current closing price is significantly lower than its highest price over the past 15 trading days, adjusted for volatility (measured by ATR).
- Its RSI (a measure of momentum over 4 periods) is below a lower threshold, indicating the stock might be oversold.
- Losing Trade Entry: If a previous trade resulted in a loss, this rule suggests buying a stock when:
- Its price is significantly lower than the exit price of the losing trade, adjusted for volatility.
- Its RSI is below its lower threshold, suggesting it may be a good time to re-enter at a potentially lower price.
- Profit Target: This rule sets a target price to sell and take profits, calculated as the lowest price during the trade plus a multiple of the ATR (Average True Range).
6. How it Works in Practice
Remember, while strategies like RSI-4 can provide great trade setups, they're not foolproof. Market conditions can at times be unfavorable, and risk management is crucial. Always be prepared for the possibility of loss.

IDENTIFY OPPORTUNITY
Use the rules to find stocks that have hit a low point according to the strategy’s criteria.

ENTER THE TRADE:
Buy the stock when it meets the entry conditions.

SET PROFIT TARGET
Know in advance what the profit target is, based on the strategy’s profit target rule.

EXIT STRATEGY:
Sell the stock when it reaches the profit target or if any conditions suggest it’s time to exit to minimise losses.

LEVERAGE IS OPTIONAL

OUTSOURCE YOUR TRADE EXECUTION
This strategy is fully mechanical which allows you to outsource the management of the strategy on your account to MyTradingAdvisor. MTA will monitor the system on a day to day basis and execute the orders for the system on your account according to the terms and condition in the Strategy Execution Document.
7. Risk Management
When using the RSI-4 strategy risk management should involve diversifying across a portfolio of 5-15 stocks. Diversification spreads the risk and reduces the volatility that can come from relying on the performance of a single or small group of stocks. The key is to select stocks that qualify under the RSI-4 criteria from the Nasdaq 100 Index, which provides a wide array of high-growth potential companies.
By trading a carefully chosen set of 5-15 stocks, traders can manage their exposure to market fluctuations more effectively. This quantity is manageable for individual traders to monitor closely, ensuring they can react swiftly to RSI indicators and market changes. The diversification within this range allows for the purchase of different companies, where the negative performance of one or a few stocks can be offset by gains in others.
Furthermore, this approach aligns with the principles of the RSI-4 strategy, which capitalises on short-term market movements with trades lasting on average one month. By having a diversified yet focused portfolio, traders can apply this strategy across multiple stocks, increasing their chances of capturing profitable trades without putting their entire investment at risk in one or two positions.
Overall, maintaining a portfolio of 5-15 stocks while using the RSI-4 strategy is a practical approach to risk management. It enables traders to stay agile, making the most of the short-term trading opportunities that the Nasdaq 100 Index offers, while spreading their risk across multiple, carefully selected investments.
8. Strategy Statistics
The table below covers the historical performance of the trading system rules from January 1, 2009, to February 19, 2024, assuming a position size of $10,000 per trade in stocks in the Nasdaq 100 Index as at the 28th February 2024.
The purpose of providing the system statistics is to help you determine historical profitability for the rules utilised by the system across the spectrum of Nasdaq100 stocks.
Closed Trade Equity Curve
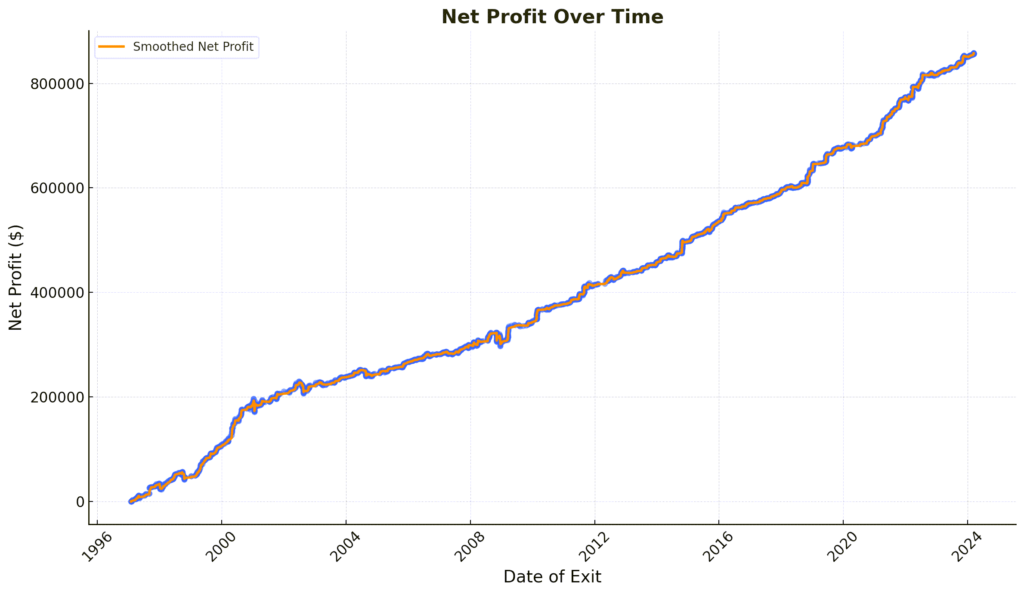
The closed trade equity curve show the results for the RSI-4 system rules if traded with a fixed US$10,000 per trade from January 1, 1997, to February 19, 2024, on the stocks in the Nasdaq 100 Index as at 28th February 2024.
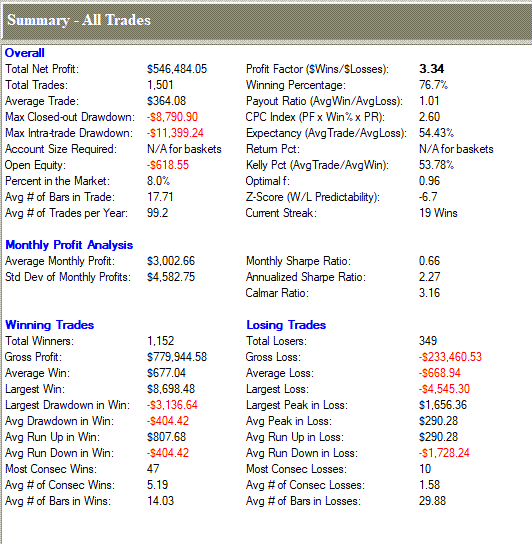
OVERALL PERFORMANCE
- Total Net Profit: $546,484.05. If you had of taken every single trade on the current constituents as at Feb 19th 2024 of the Nasdaq 100 Index since the 1st Jan 2009 through to the 19th Feb 2024 with a fixed trade allocation of $10,000 per trade the system generated a total profit of $546,484.05. 93 out of the 100 stocks were profitable with this strategy over the testing period.
- Total Trades: 1,501 trades were tested during the given period.
- Average Trade: Each trade on average yielded $364.08 (3.64%) in profit.
- Max Closed-out Drawdown: The maximum drawdown, indicating the largest drop from peak to trough, was -$8,790.90 in total.
- Max Intra-trade Drawdown: The maximum amount lost at any point in a trade before it was closed was -$11,399.24 in total.
- Percent in the Market: The strategy was in the market 8% of the time.
- Average # of Bars in Trade: Trades lasted for an average of 17.71 trading days, indicating the average duration of trades.
- Winning Percentage: 76.7% of the trades were profitable.
- Profit Factor (Wins/Losses): For every dollar lost, $3.34 was won.
- Expectancy: The average trade over the average loss was 54.43%.

MONTHLY PROFIT ANALYSIS
- Average Monthly Profit: $3,002.66, showing a consistent return per month.
- Standard Deviation of Monthly Profits: $4,582.75, indicating variability in monthly profits.

WINNING VS. LOSING TRADES
- Winning Trades: There were 1,152 winning trades
with a total gross profit of $779,944.58.
- Largest Win: The largest single winning trade
was $8,698.48 (86.98%).
- Losing Trades: There were 349 losing trades with
a total gross loss of -$233,460.53.
- Largest Loss: The largest single losing trade
was -$4,545.30 (45.45%).

TRADE EFFICIENCY
- Average Win: The average profit for winning trades was $677.04.
- Average Loss: The average loss for losing trades was -$668.94, indicating a balance between the average win and average loss.
- Return Per Trade: On average, for the assumed $10k per trade, the return per trade was $364.

RISK METRICS
- Kelly Percentage: 53.78%, which indicates the proportion of capital to be used in trades as suggested by the Kelly criterion, however we suggest an allocation of no more than 10-20% of equity per trade or less.
- Calmar Ratio: 3.16, which is a measure of the strategy’s return rate over its maximum drawdown, indicating a favourable risk-adjusted return.
- Monthly Sharpe Ratio: 0.66, this figure suggests that for every unit of risk (volatility) taken per month, the strategy has returned 0.66 units of return. A Sharpe ratio greater than 0 indicates that the return on the investment is better than the risk-free rate of return, with higher values suggesting a better risk-adjusted return. A monthly Sharpe ratio of 0.66 is relatively moderate, indicating the strategy offers a decent return for the level of risk taken on a monthly basis.
- Annualised Sharpe Ratio: 2.27, to annualise the Sharpe ratio, the monthly Sharpe ratio is typically multiplied by the square root of the number of periods in a year (in this case, √12 for months). The annualised Sharpe ratio gives an idea of the strategy’s performance over an entire year, as opposed to just on a monthly basis. An annualized Sharpe ratio of 2.27 is considered quite high, indicating that the strategy has a strong risk-adjusted performance when considered on an annual basis. Investors often look for a Sharpe ratio higher than 1 on an annual basis, so a ratio of 2.27 would typically be seen as very attractive.

SUMMARY
Overall, the RSI4 Strategy rules have been quite successful assuming correct execution, with a high winning percentage and a profit factor significantly greater than 1, suggesting that the strategy’s wins are more than compensating for the losses. However, the risk metrics and drawdowns should be carefully considered for understanding the risk profile of the strategy.
9. Examples
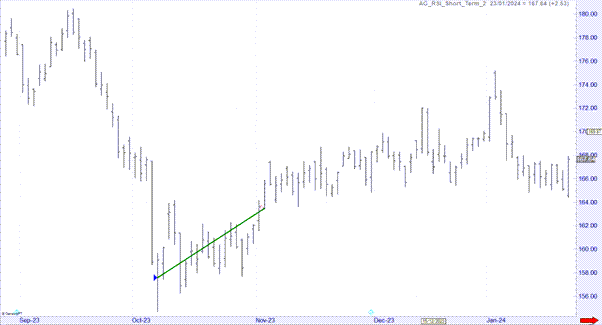
Trade Example#1 – PepsiCo (PEP)
- Entry on the 6th of October 2023 at $157.58
- Exit on the 3rd of November 2023 at $163.49
- Result: Profit of $5.91 or 3.75%
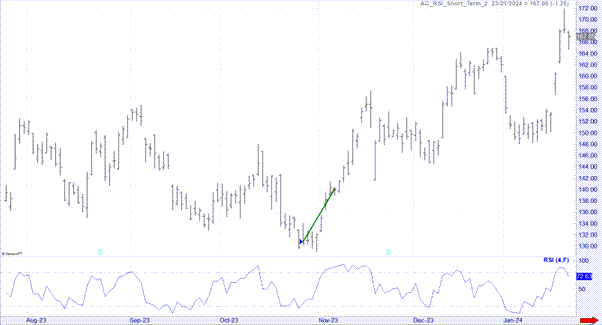
Trade Example#2 – Applied Materials (AMAT)
- Entry on the 26th of October 2023 at $130.83
- Exit on the 7th of November 2023 at $140.10
- Result: Profit of $9.27 or 7.08%
Trade Example#3 – Cisco Systems (CSCO)
- Entry on the 15th of February 2022 at $50.44
- Exit on the 1st of June 2022 at $43.06
- Result: Loss of $7.38 or -14.63%
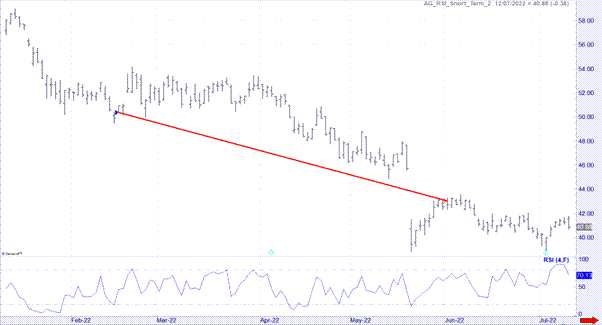
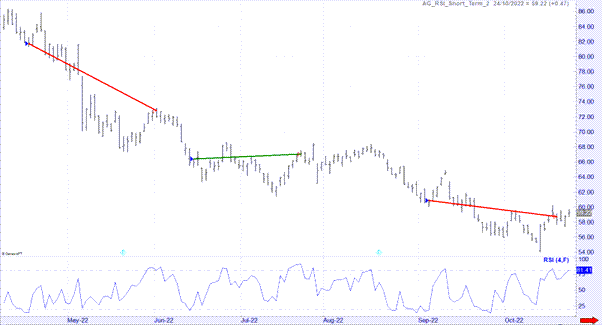
Trade Example#4 – Cognizant Technologies (CTSH)
- Entry on the 18th of April 2022 at $81.76
- Exit on the 1st of June 2022 at $72.85
- Result: Loss of $8.91 or -10.89%
- Entry on the 14th of June 2022 at $66.42
- Exit on the 22nd of July 2022 at $67.03
- Result: Profit of $0.61 or 0.9%
- Entry on the 6th of September 2022 at $60.89
- Exit on the 19th of October 2022 at $58.67
- Result: Loss of $2.22 or -3.64%
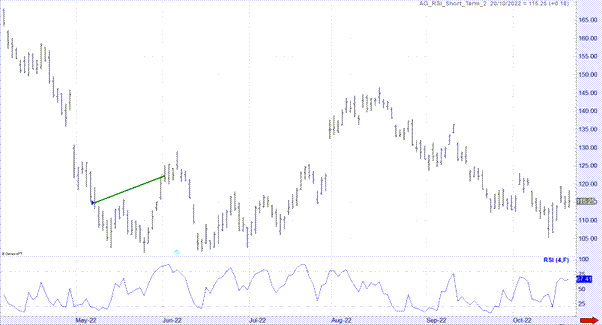
Trade Example#5 – Amazon (AMZN)
- Entry on the 6th of May 2022 at $114.85
- Exit on the 1st of June 2022 at $121.86
- Result: Loss of $7.01 or 6.10%
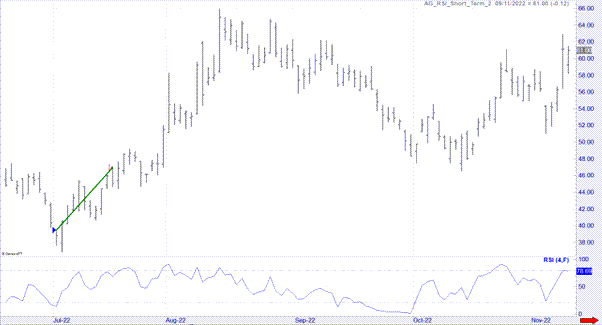
Trade Example#6 – Global Foundaries (GFS)
- Entry on the 1st of July 2022 at $39.48
- Exit on the 18th of July 2022 at $46.94
- Result: Profit of $7.46 or 18.89%
TO PROCEED CLICK "SIGN UP NOW"
The RSI4 Strategy is shown to be a robust and potentially profitable system, with the rules showing an impressive statistical record. For traders seeking to amplify their investment portfolios this strategy is particularly enticing due to its strong statistical metrics. With an exceptional win rate of 76.7%, and a profit factor indicating that for every dollar lost, $3.34 was won, the RSI4 Strategy stands out as a high-potential approach to trading within the Nasdaq 100 Index.
To have this strategy executed for you on your trading account please select the ‘Sign Up Now” button below to proceed. On the next page you will be asked for your name, email and phone number. We will check to see if you have an existing account, if so we will send you our Strategy Execution Agreement. If not we will help you to open an account with Interactive Brokers, which will be linked to MTA so we are able to execute trades on your account once funded.
- What is Share Trading01
- Key Features of Share Trading02
- Trade Both Long and Short03
- Calculating Profits and/or Losses04
- Share Trading Examples05
- Key Benefits of Shares06
- Margin Lending07
- Risks of Share Trading08
- Styles of Share Trading09
- Tools & Resources10
- How to Open an Account11
- Supported Brokers12